01 · Fleet SLOs
Every VM on its own uptime SLO.
SLO summary tiles over per-VM uptime lights: green good, red stopped, worst-VM SLO surfaced first.
Proxmox Monitoring
OpenTelemetry-native metrics for your Proxmox VE estate: per-guest uptime SLOs across qemu and LXC, PSI and memory depth kept at full cardinality, and rollups by PVE node, cluster, and storage pool. Scrape the Proxmox VE Exporter straight into your Collector — no proprietary agent on every node.
Eight views · one Proxmox estate
Click any card to enlarge · esc to close
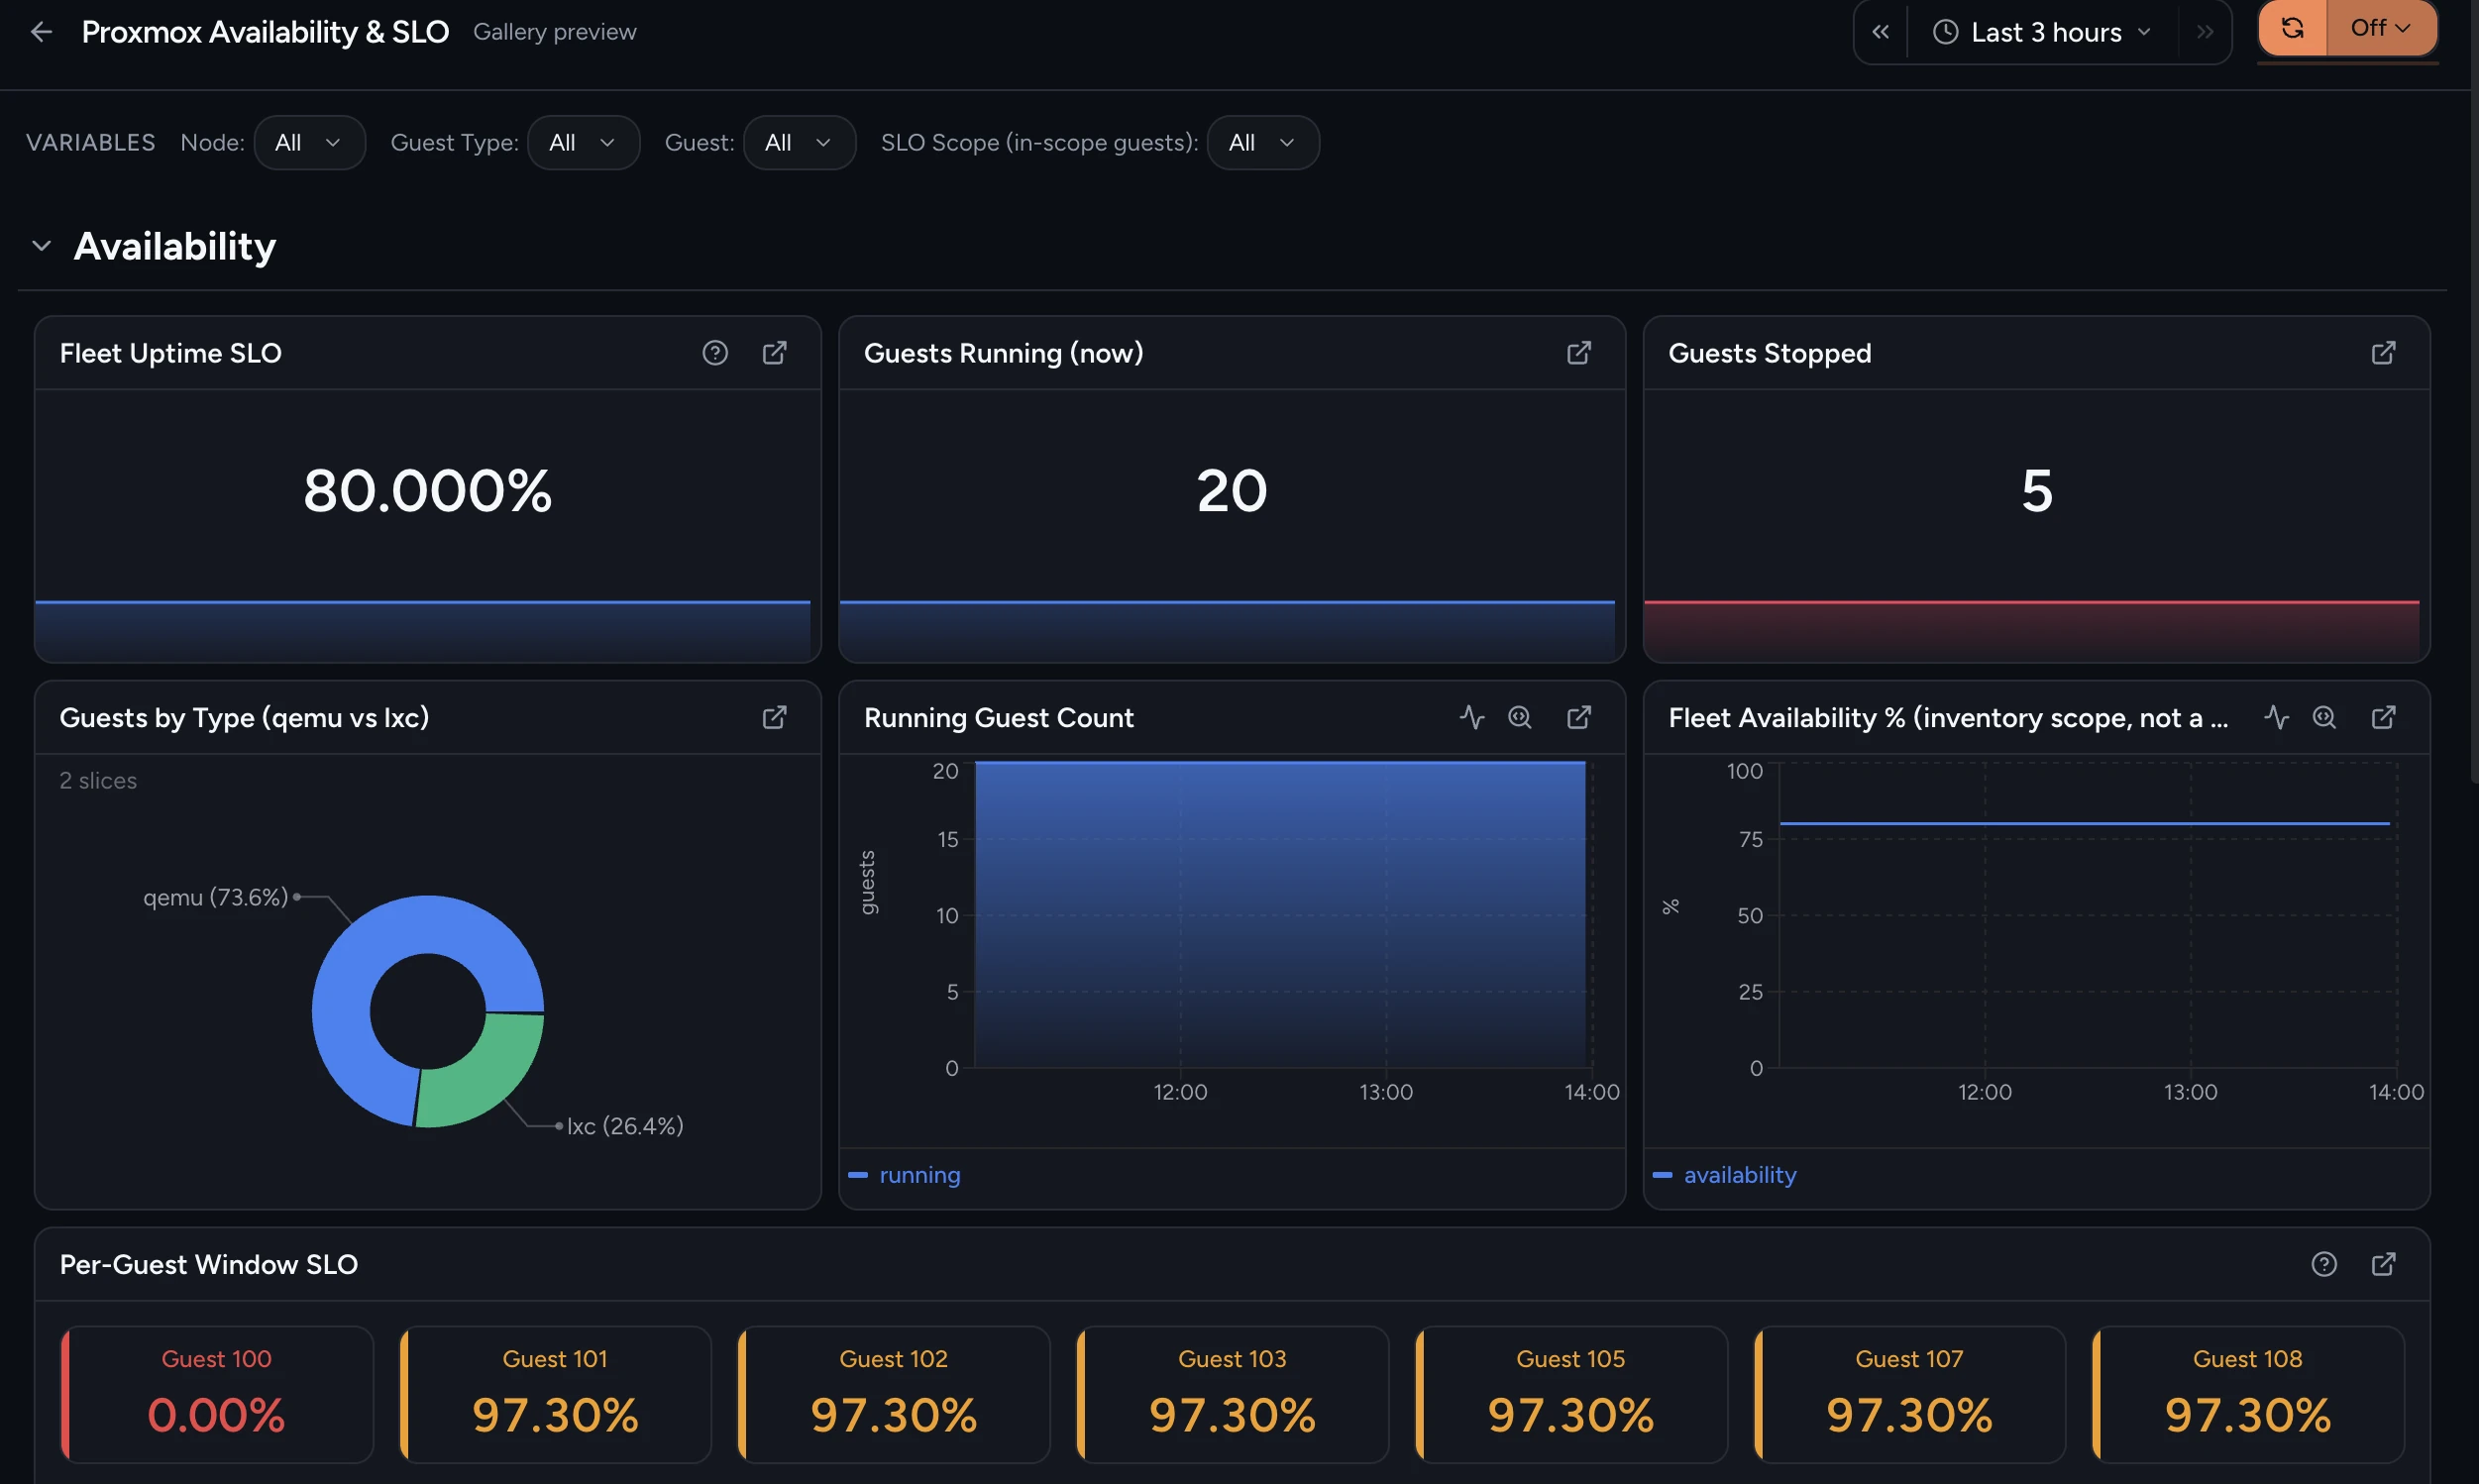
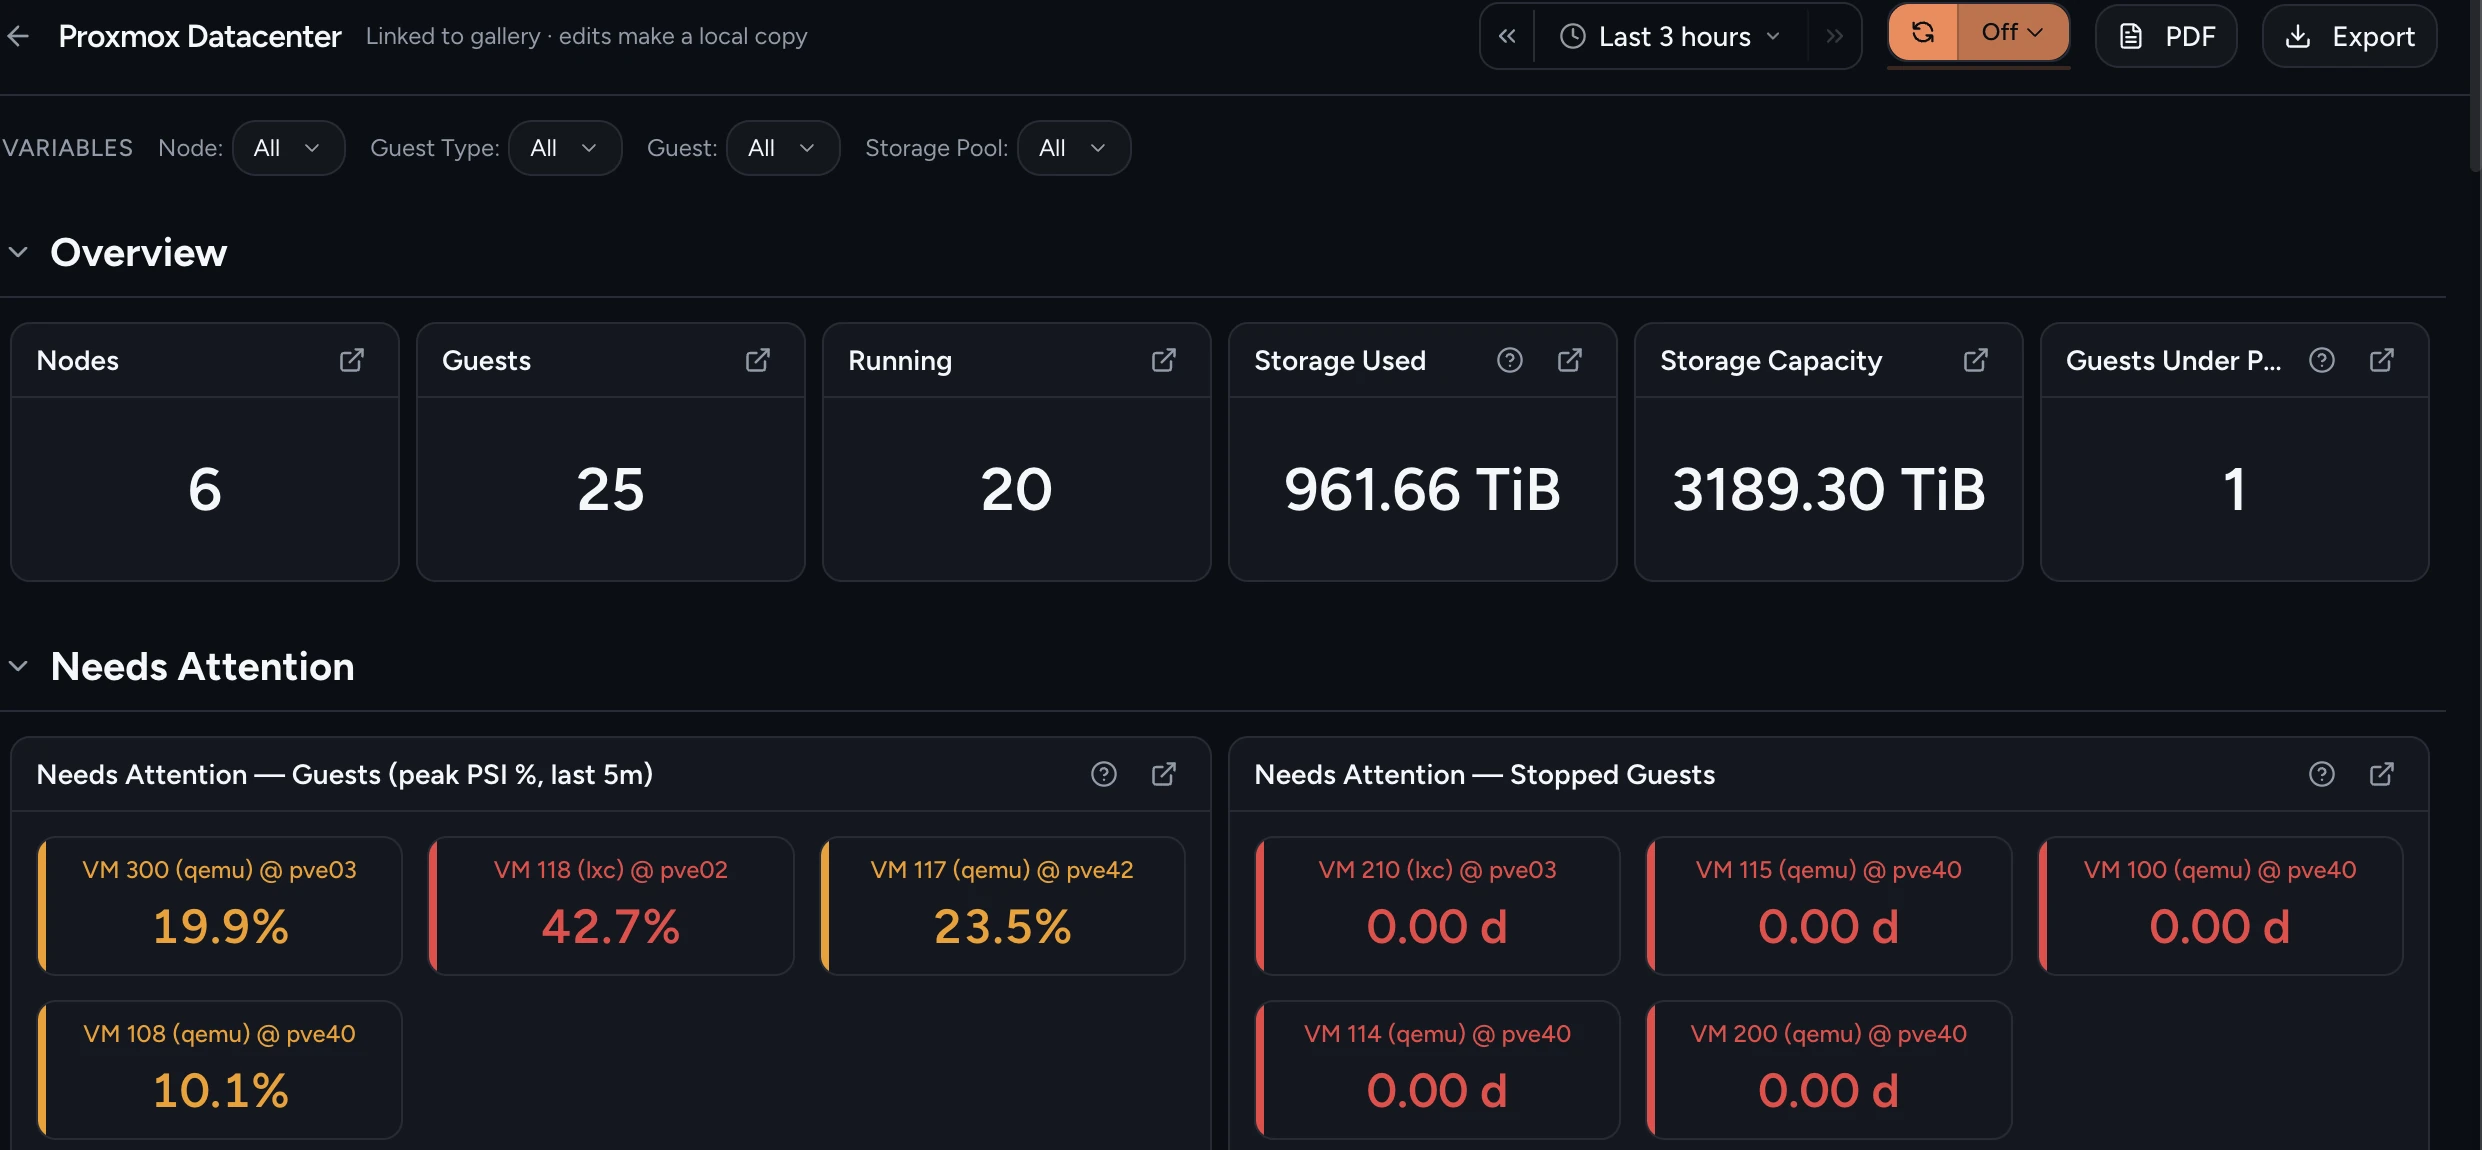
01 · Fleet SLOs
SLO summary tiles over per-VM uptime lights: green good, red stopped, worst-VM SLO surfaced first.
02 · Uptime trend
Running VM count as a chart, fleet availability %, per-VM current uptime in days, and a qemu-vs-lxc guest breakdown.
03 · Node distribution
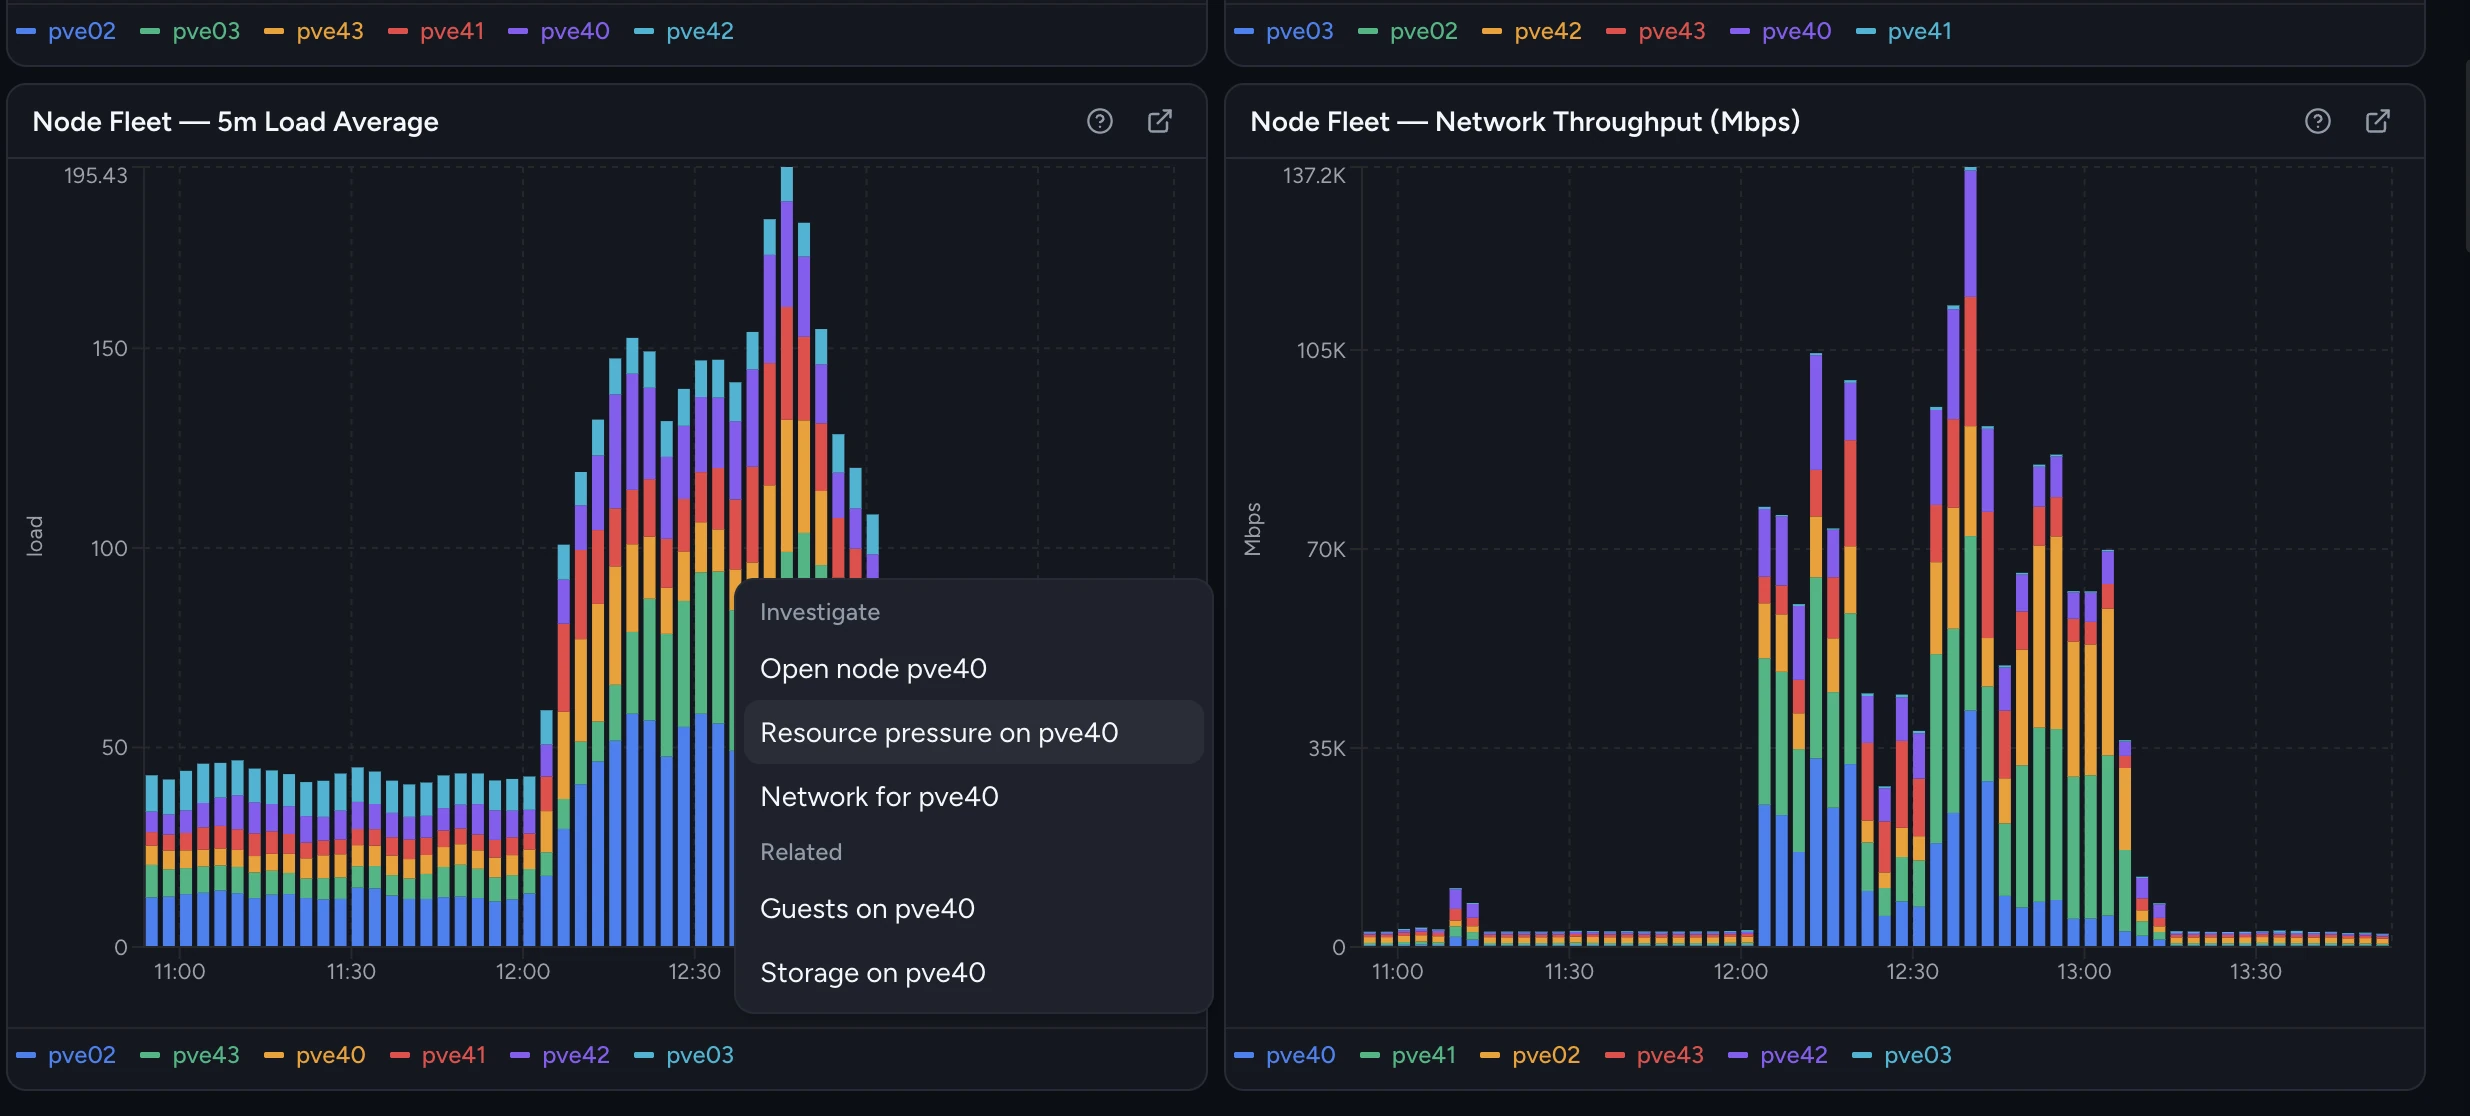
Stacked bar of VMs per Proxmox node over time, with per-VM CPU utilisation below to spot the noisy neighbour.
04 · CPU pressure
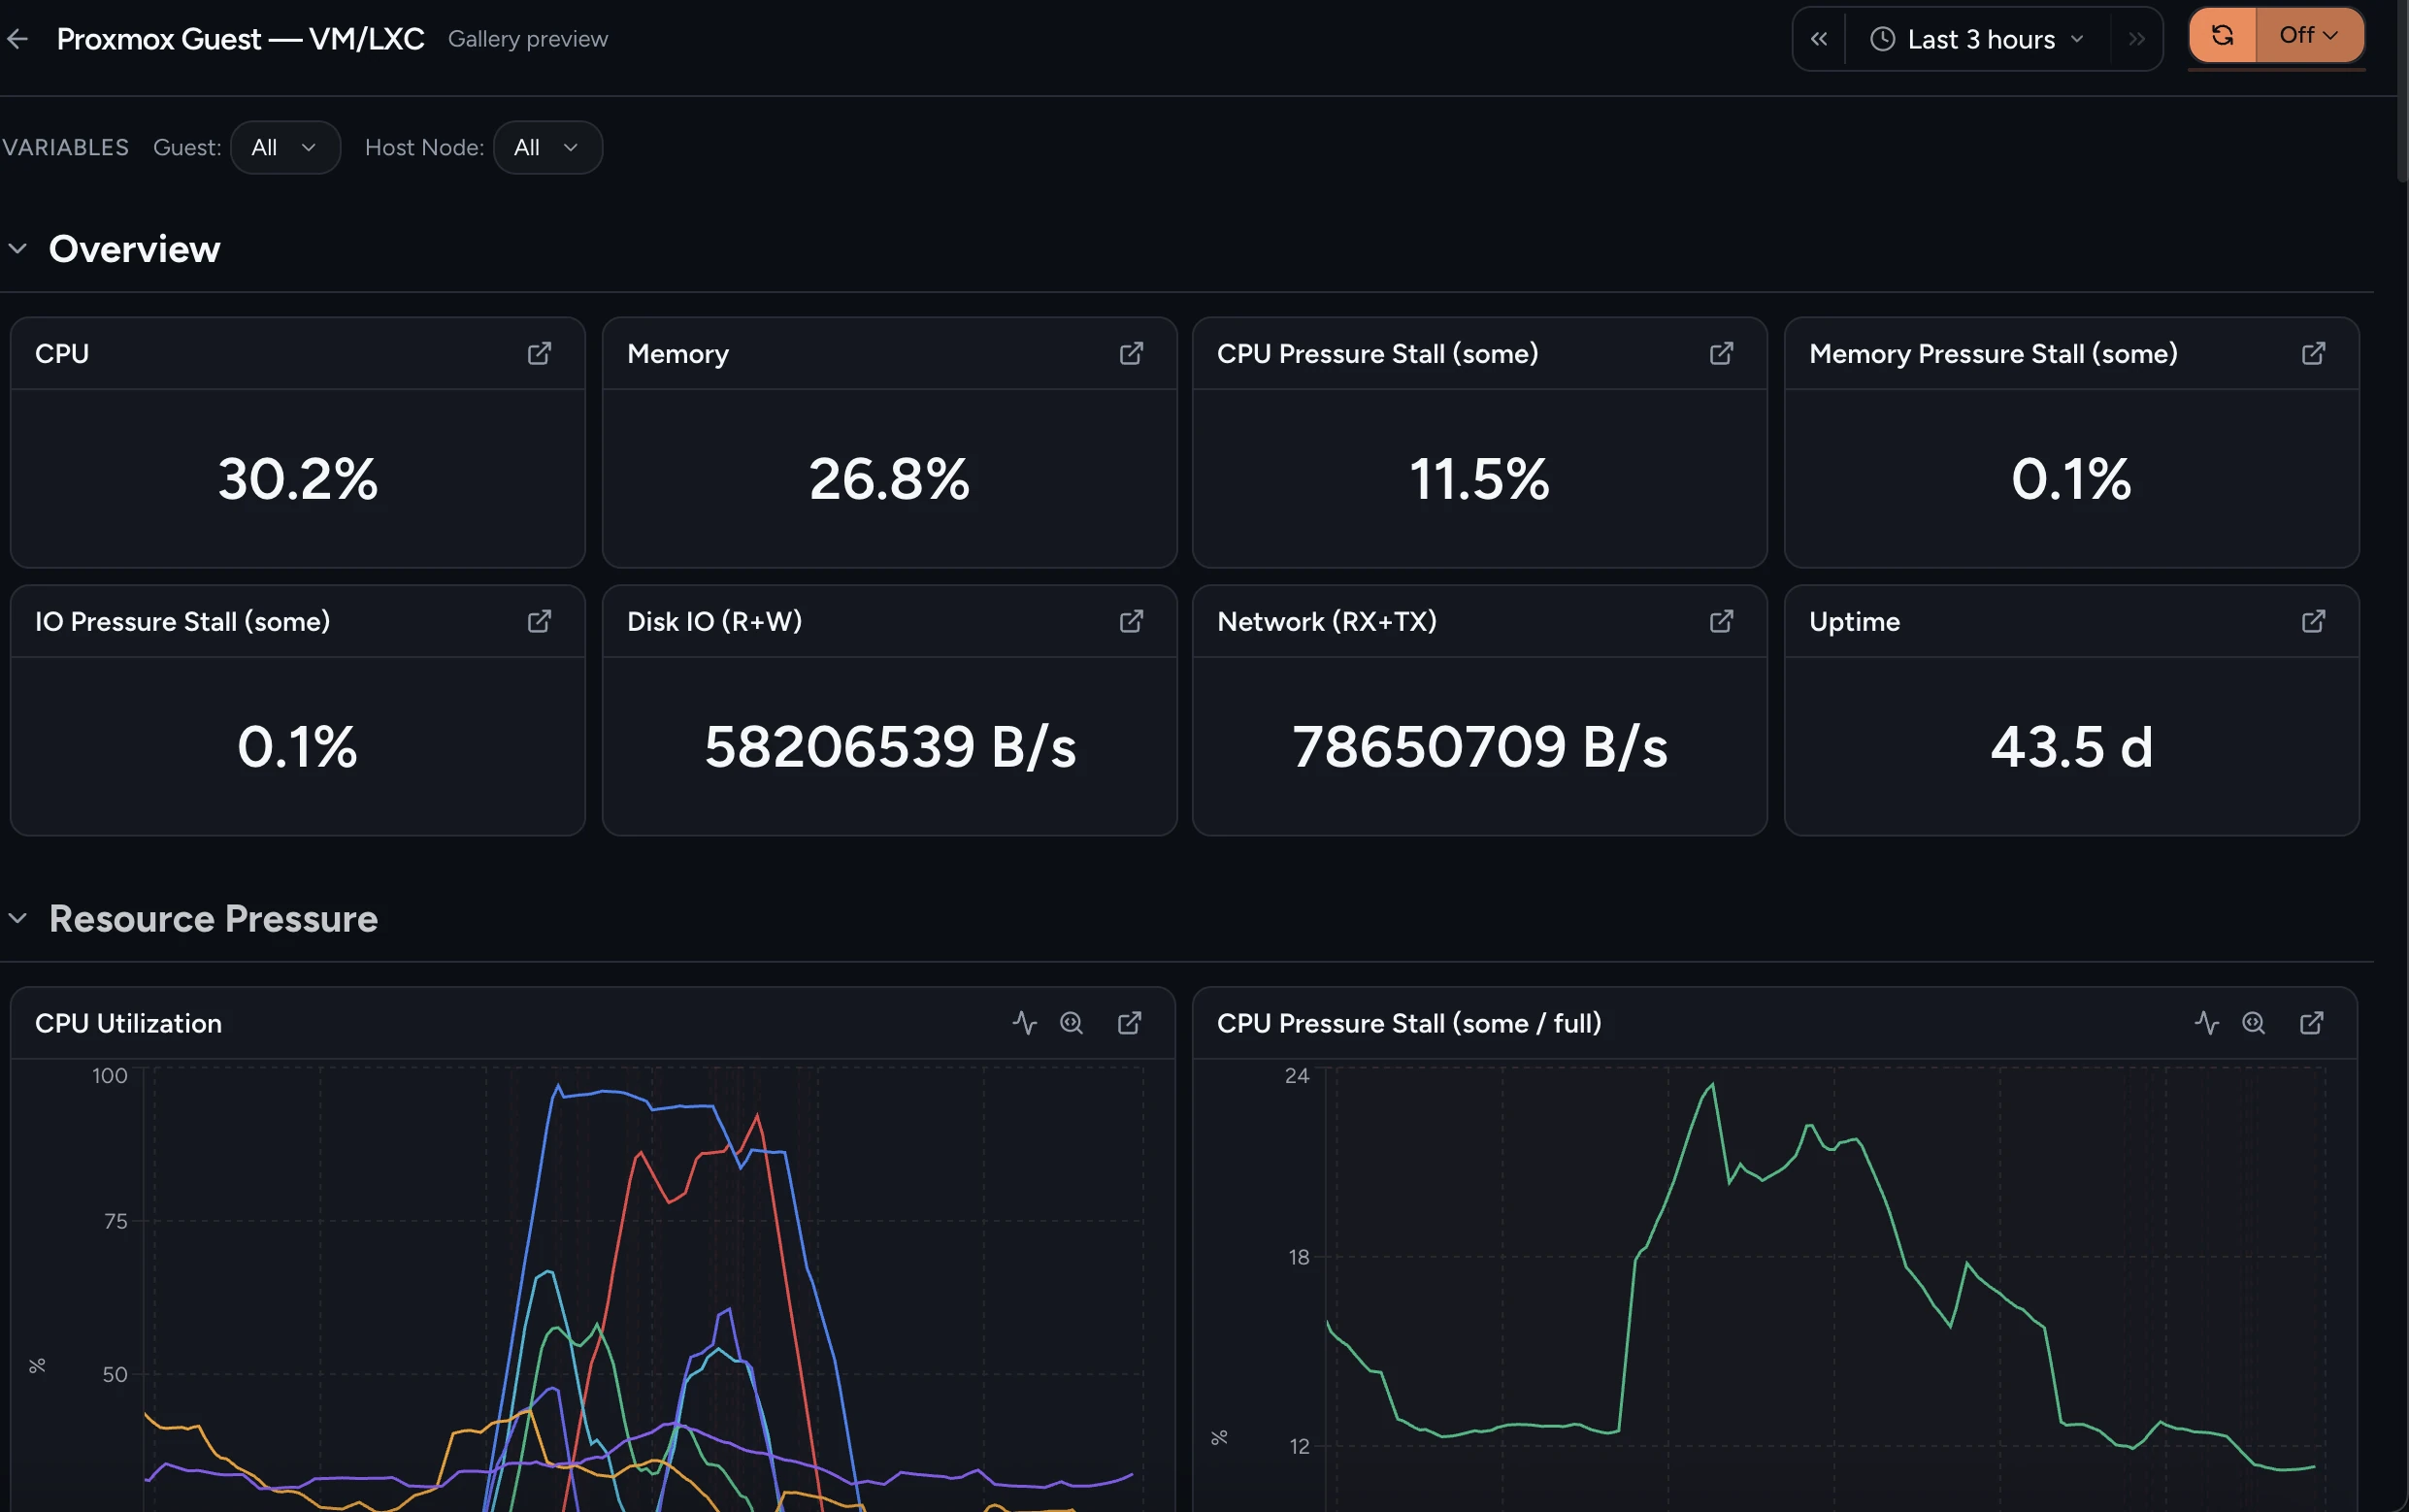
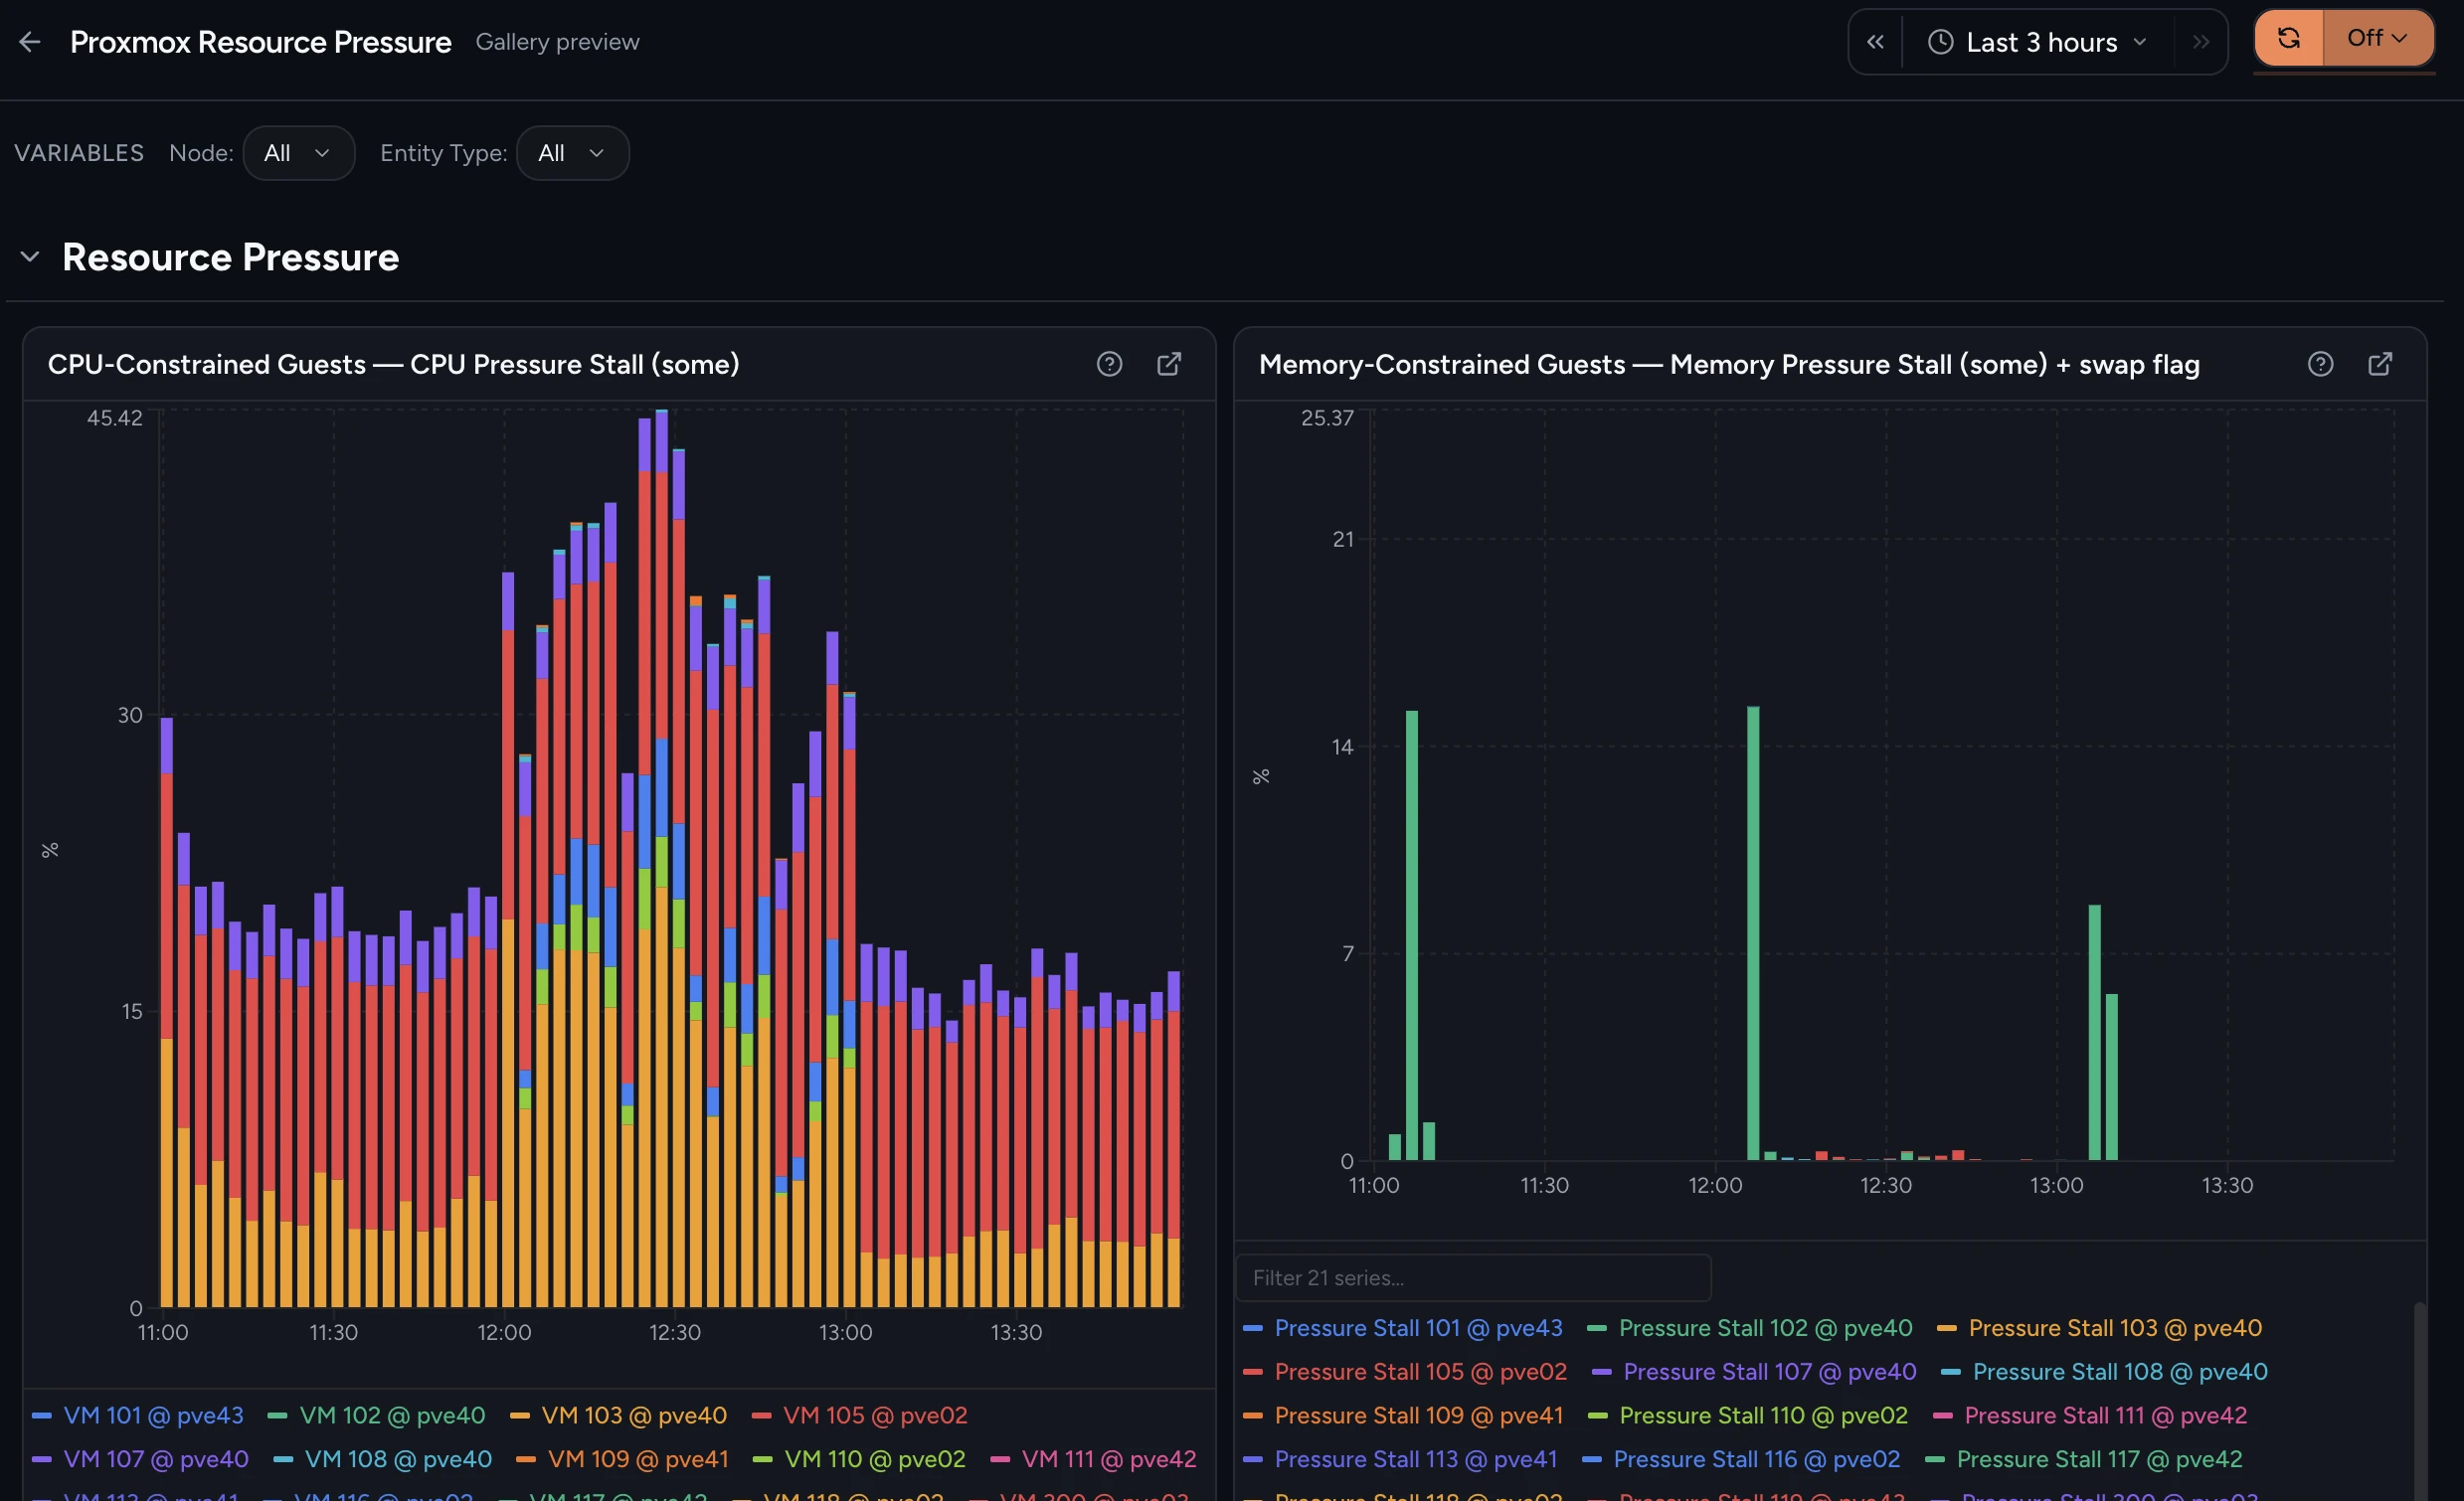
Pressure-stall CPU alongside classic utilisation and memory-used bytes. See contention before it becomes an outage.
05 · Memory depth
Every memory dimension a qemu or lxc guest exposes, kept at full fidelity across the whole fleet, with no cardinality caps.
06 · Disk I/O
Live disk throughput per VM plus stacked disk allocation across the fleet: capacity and contention on one screen.
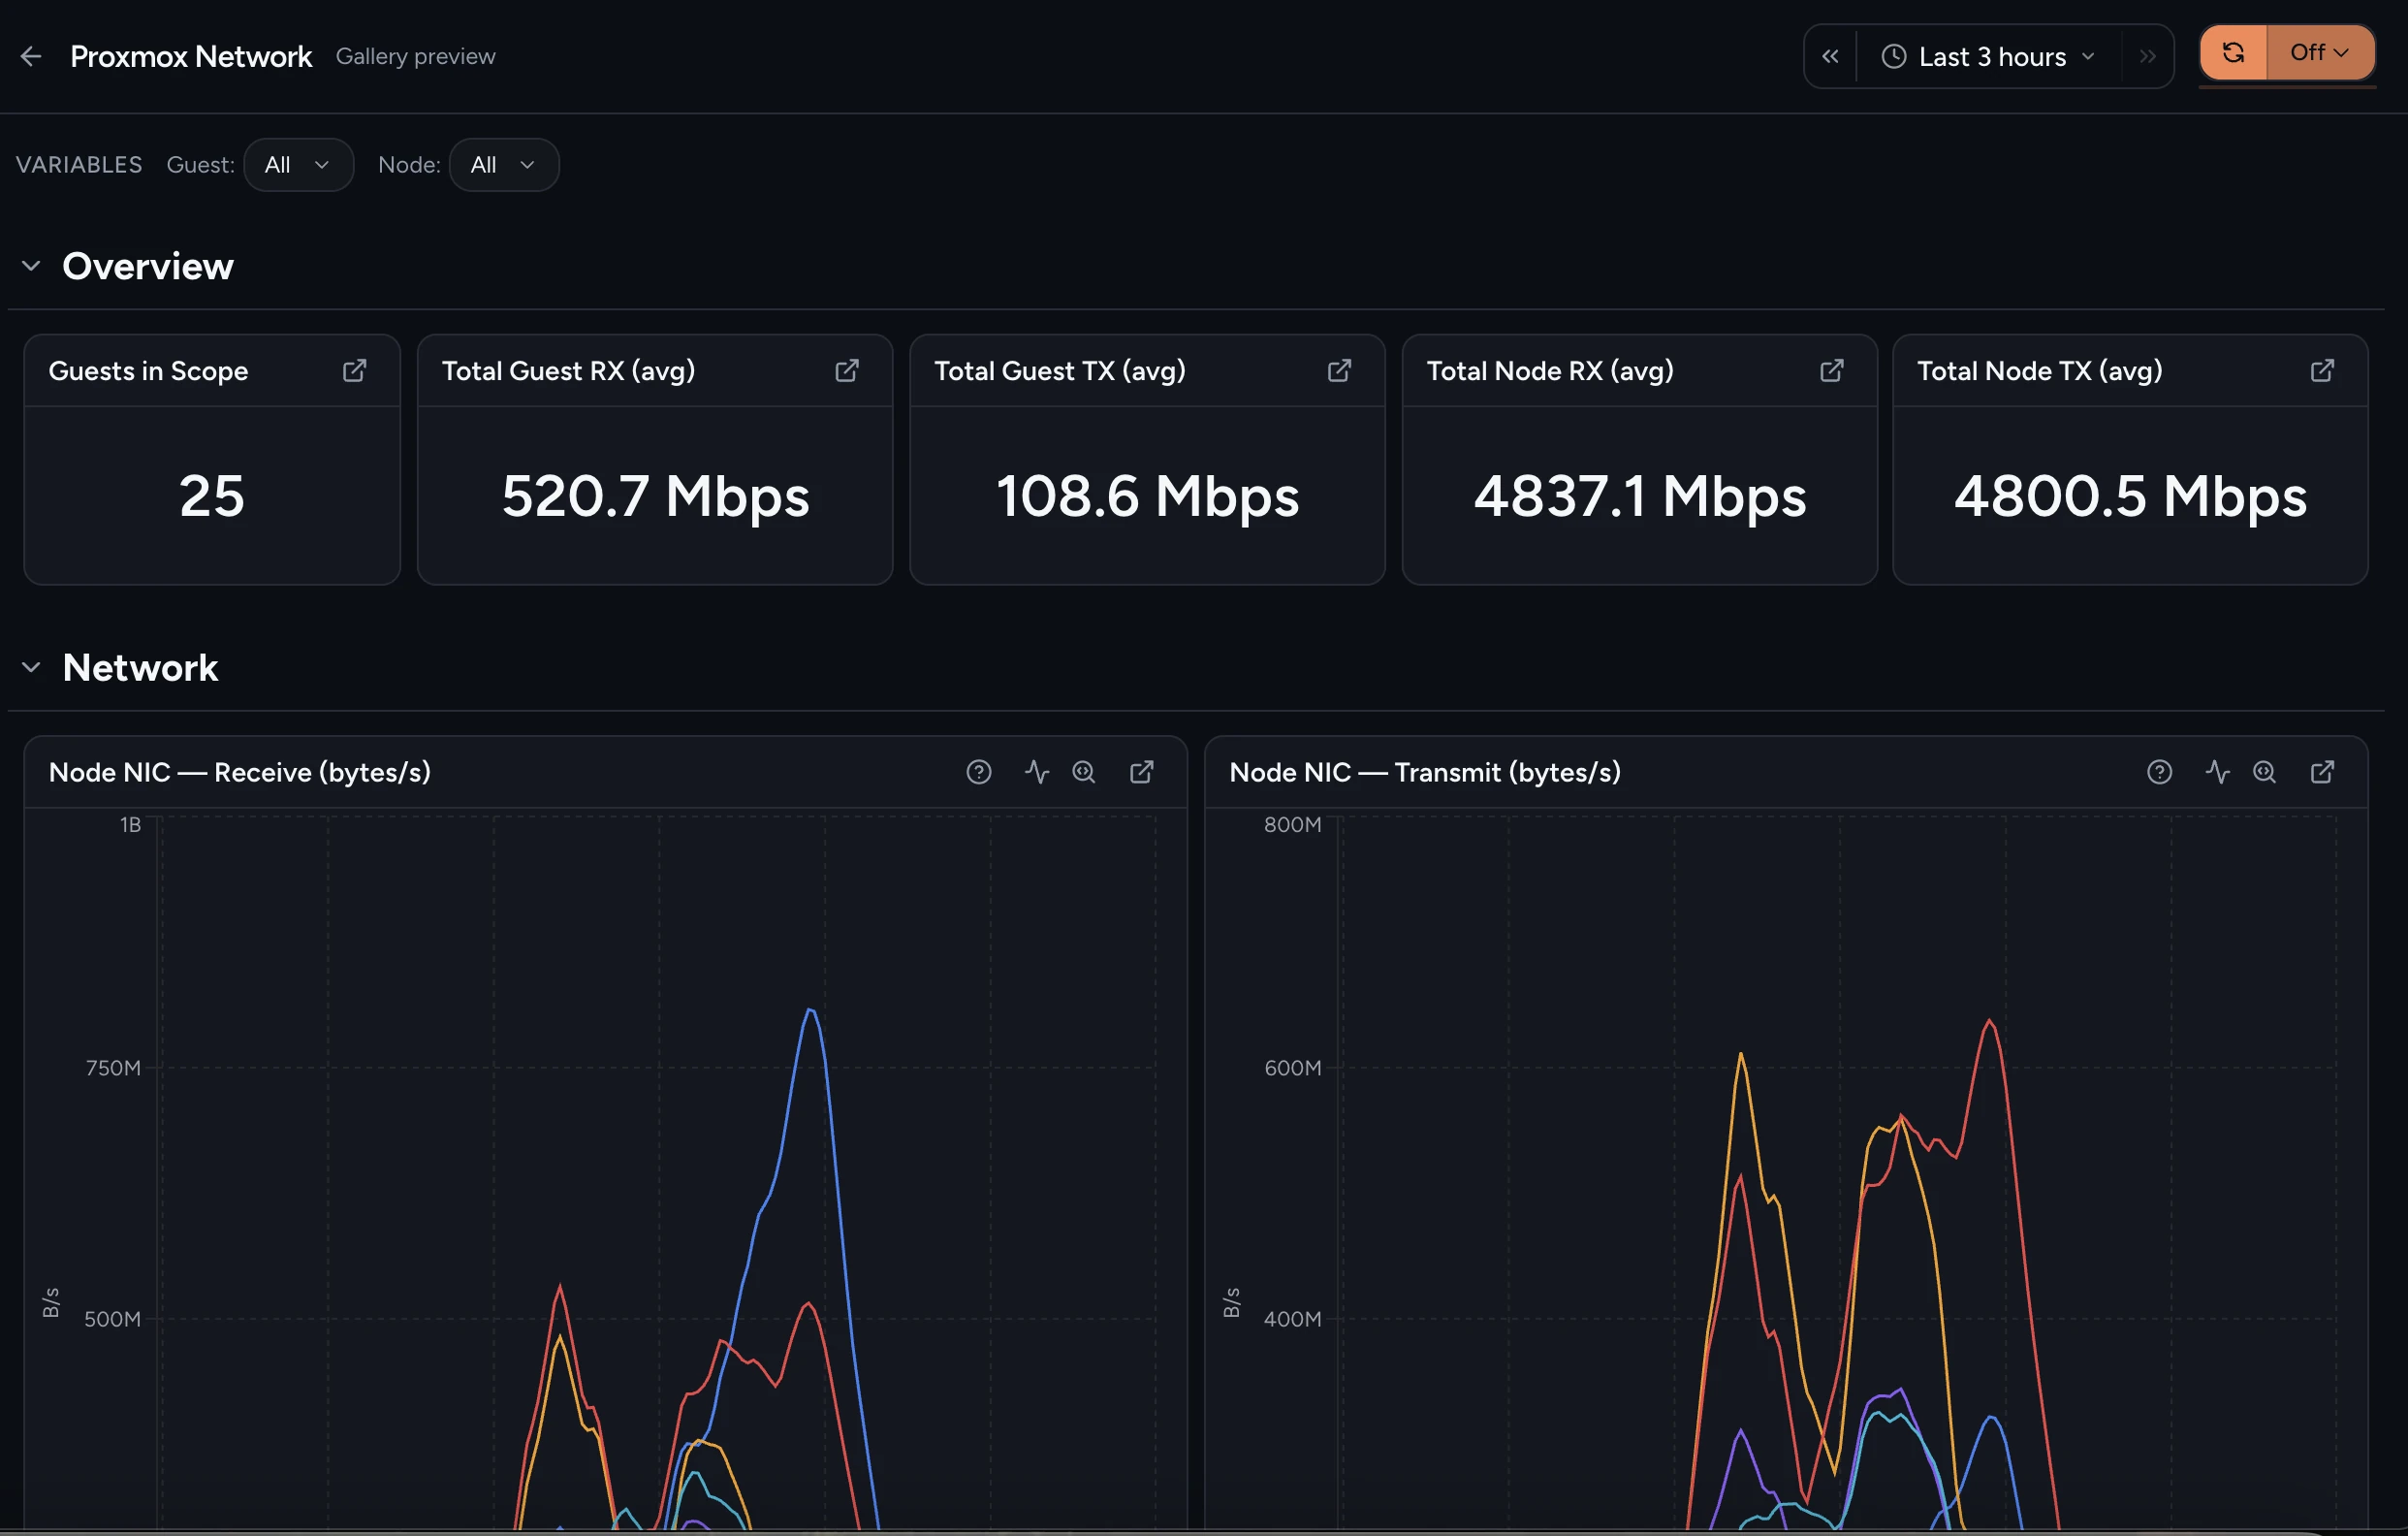
07 · Network throughput
Every VM's ingress and egress ranked and time-sliced. The storage-pool section starts right below.
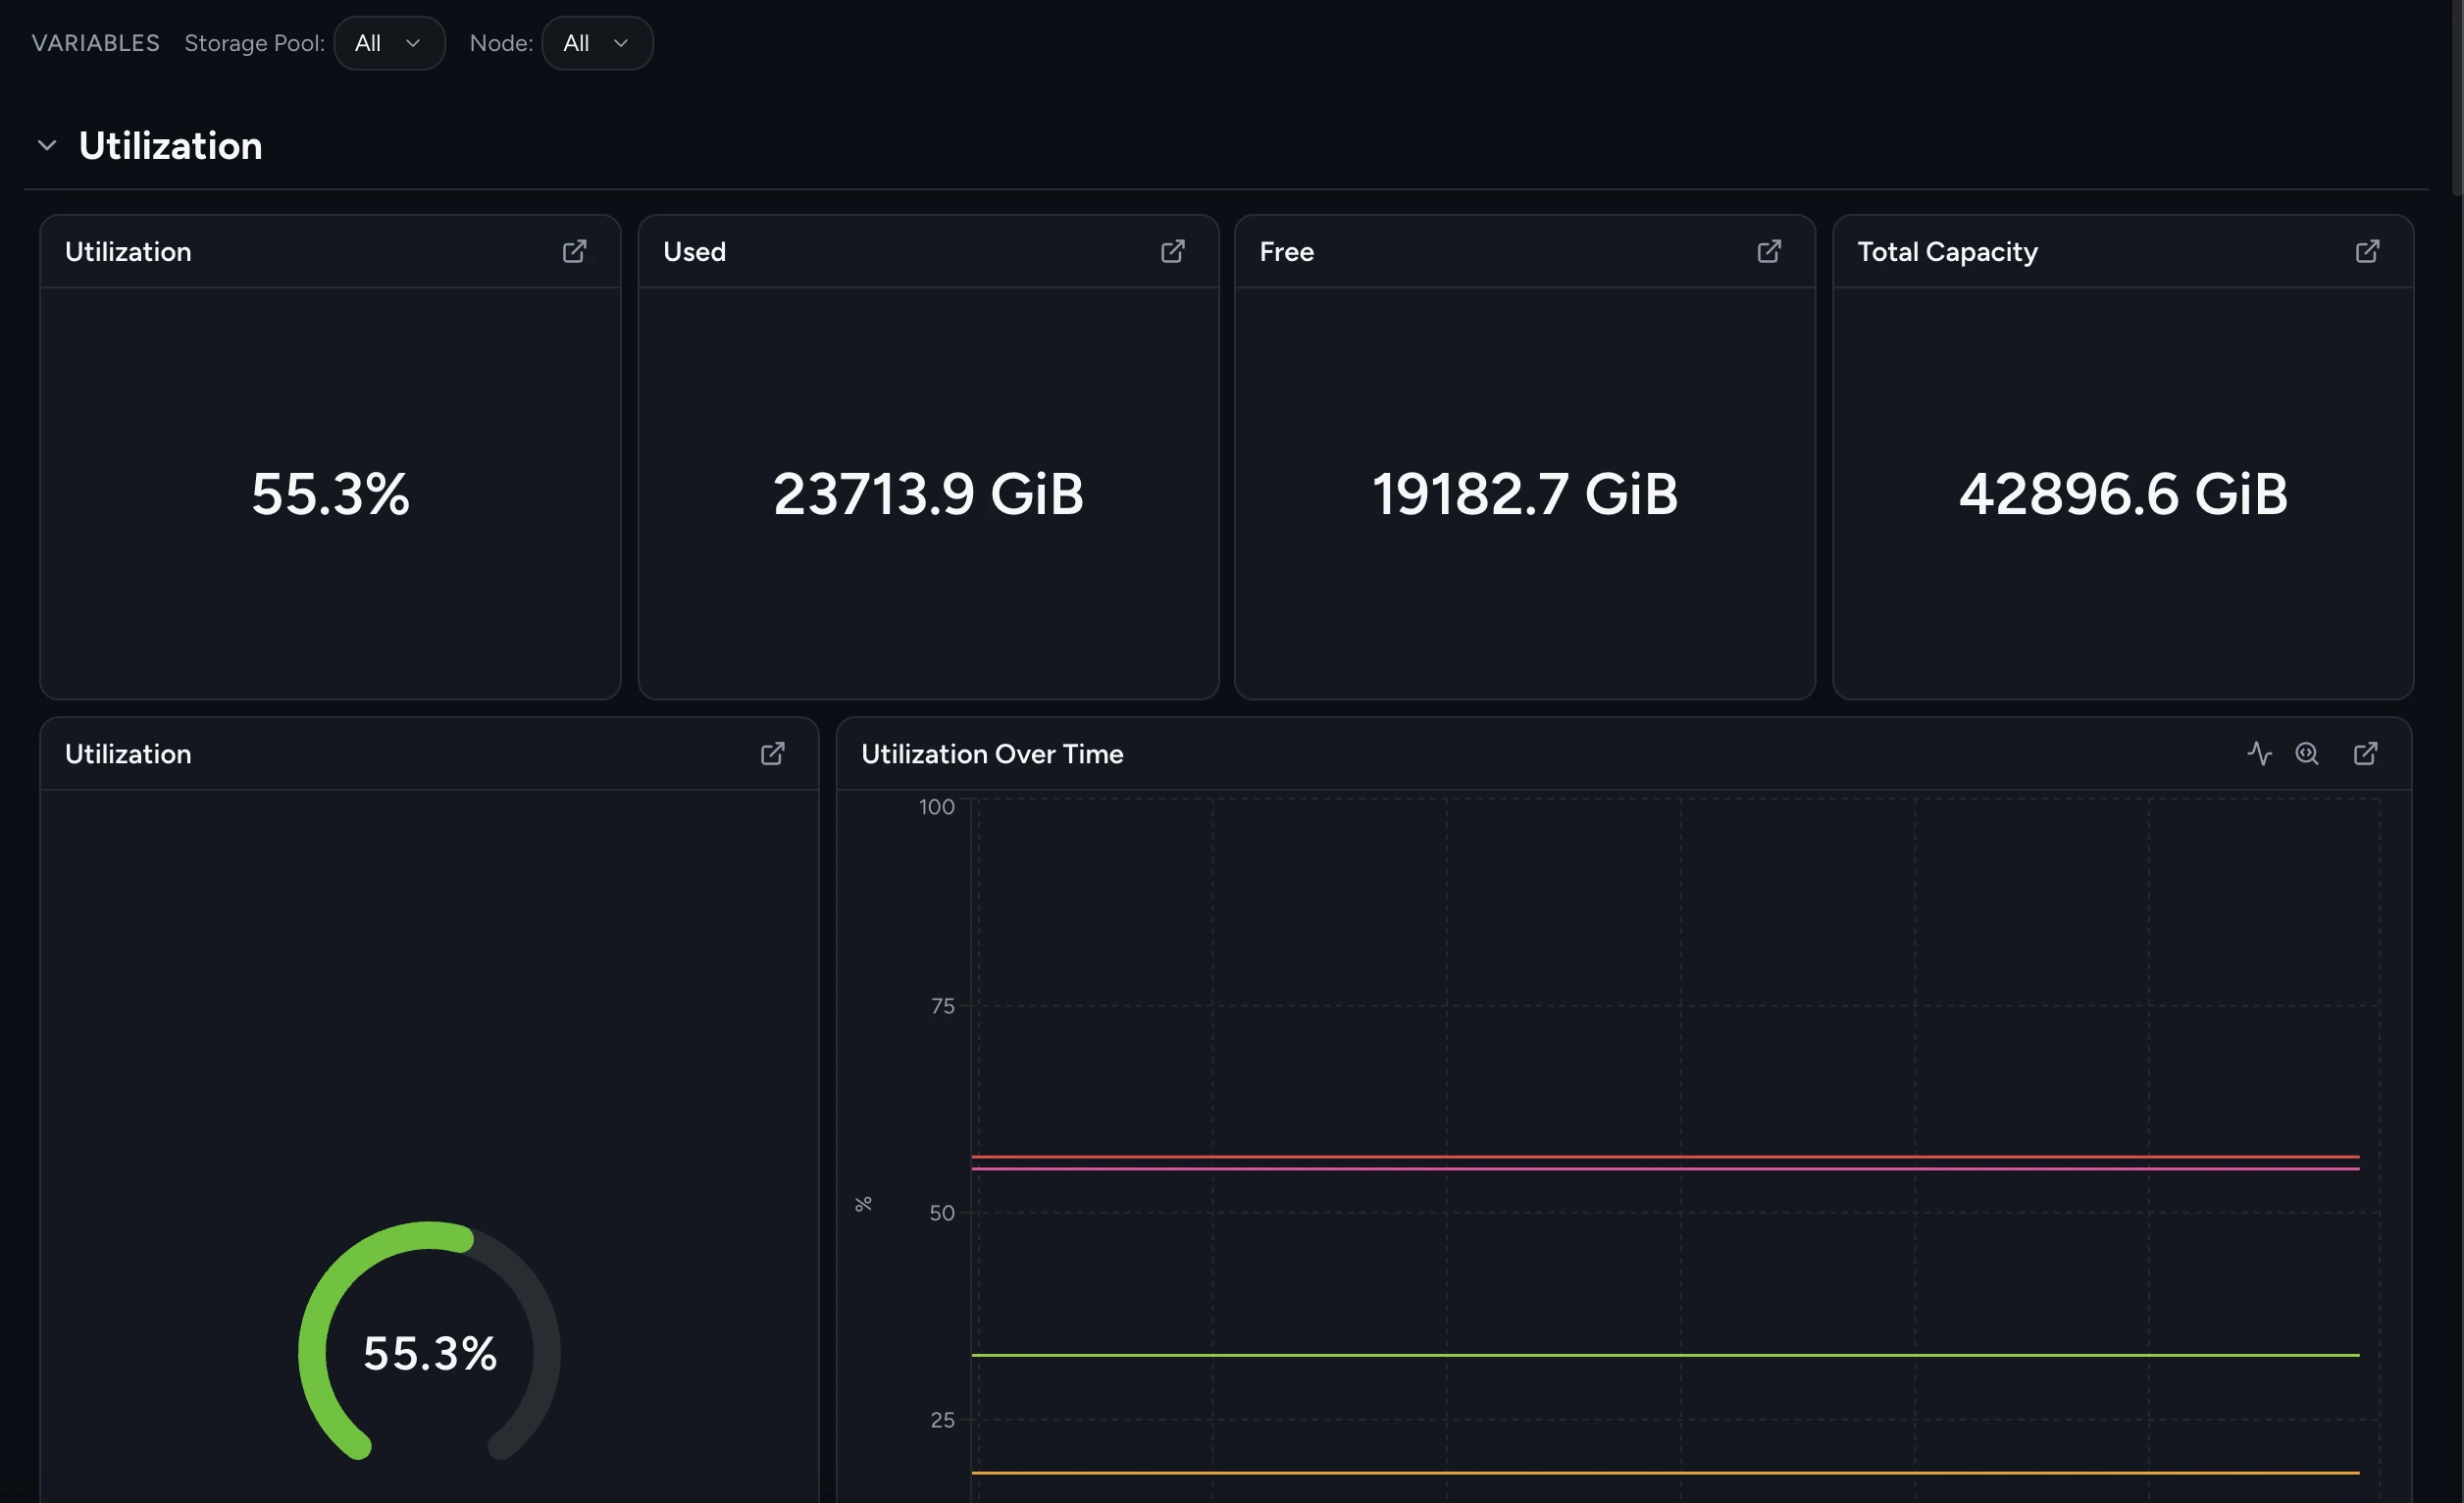
08 · Storage pools + nodes
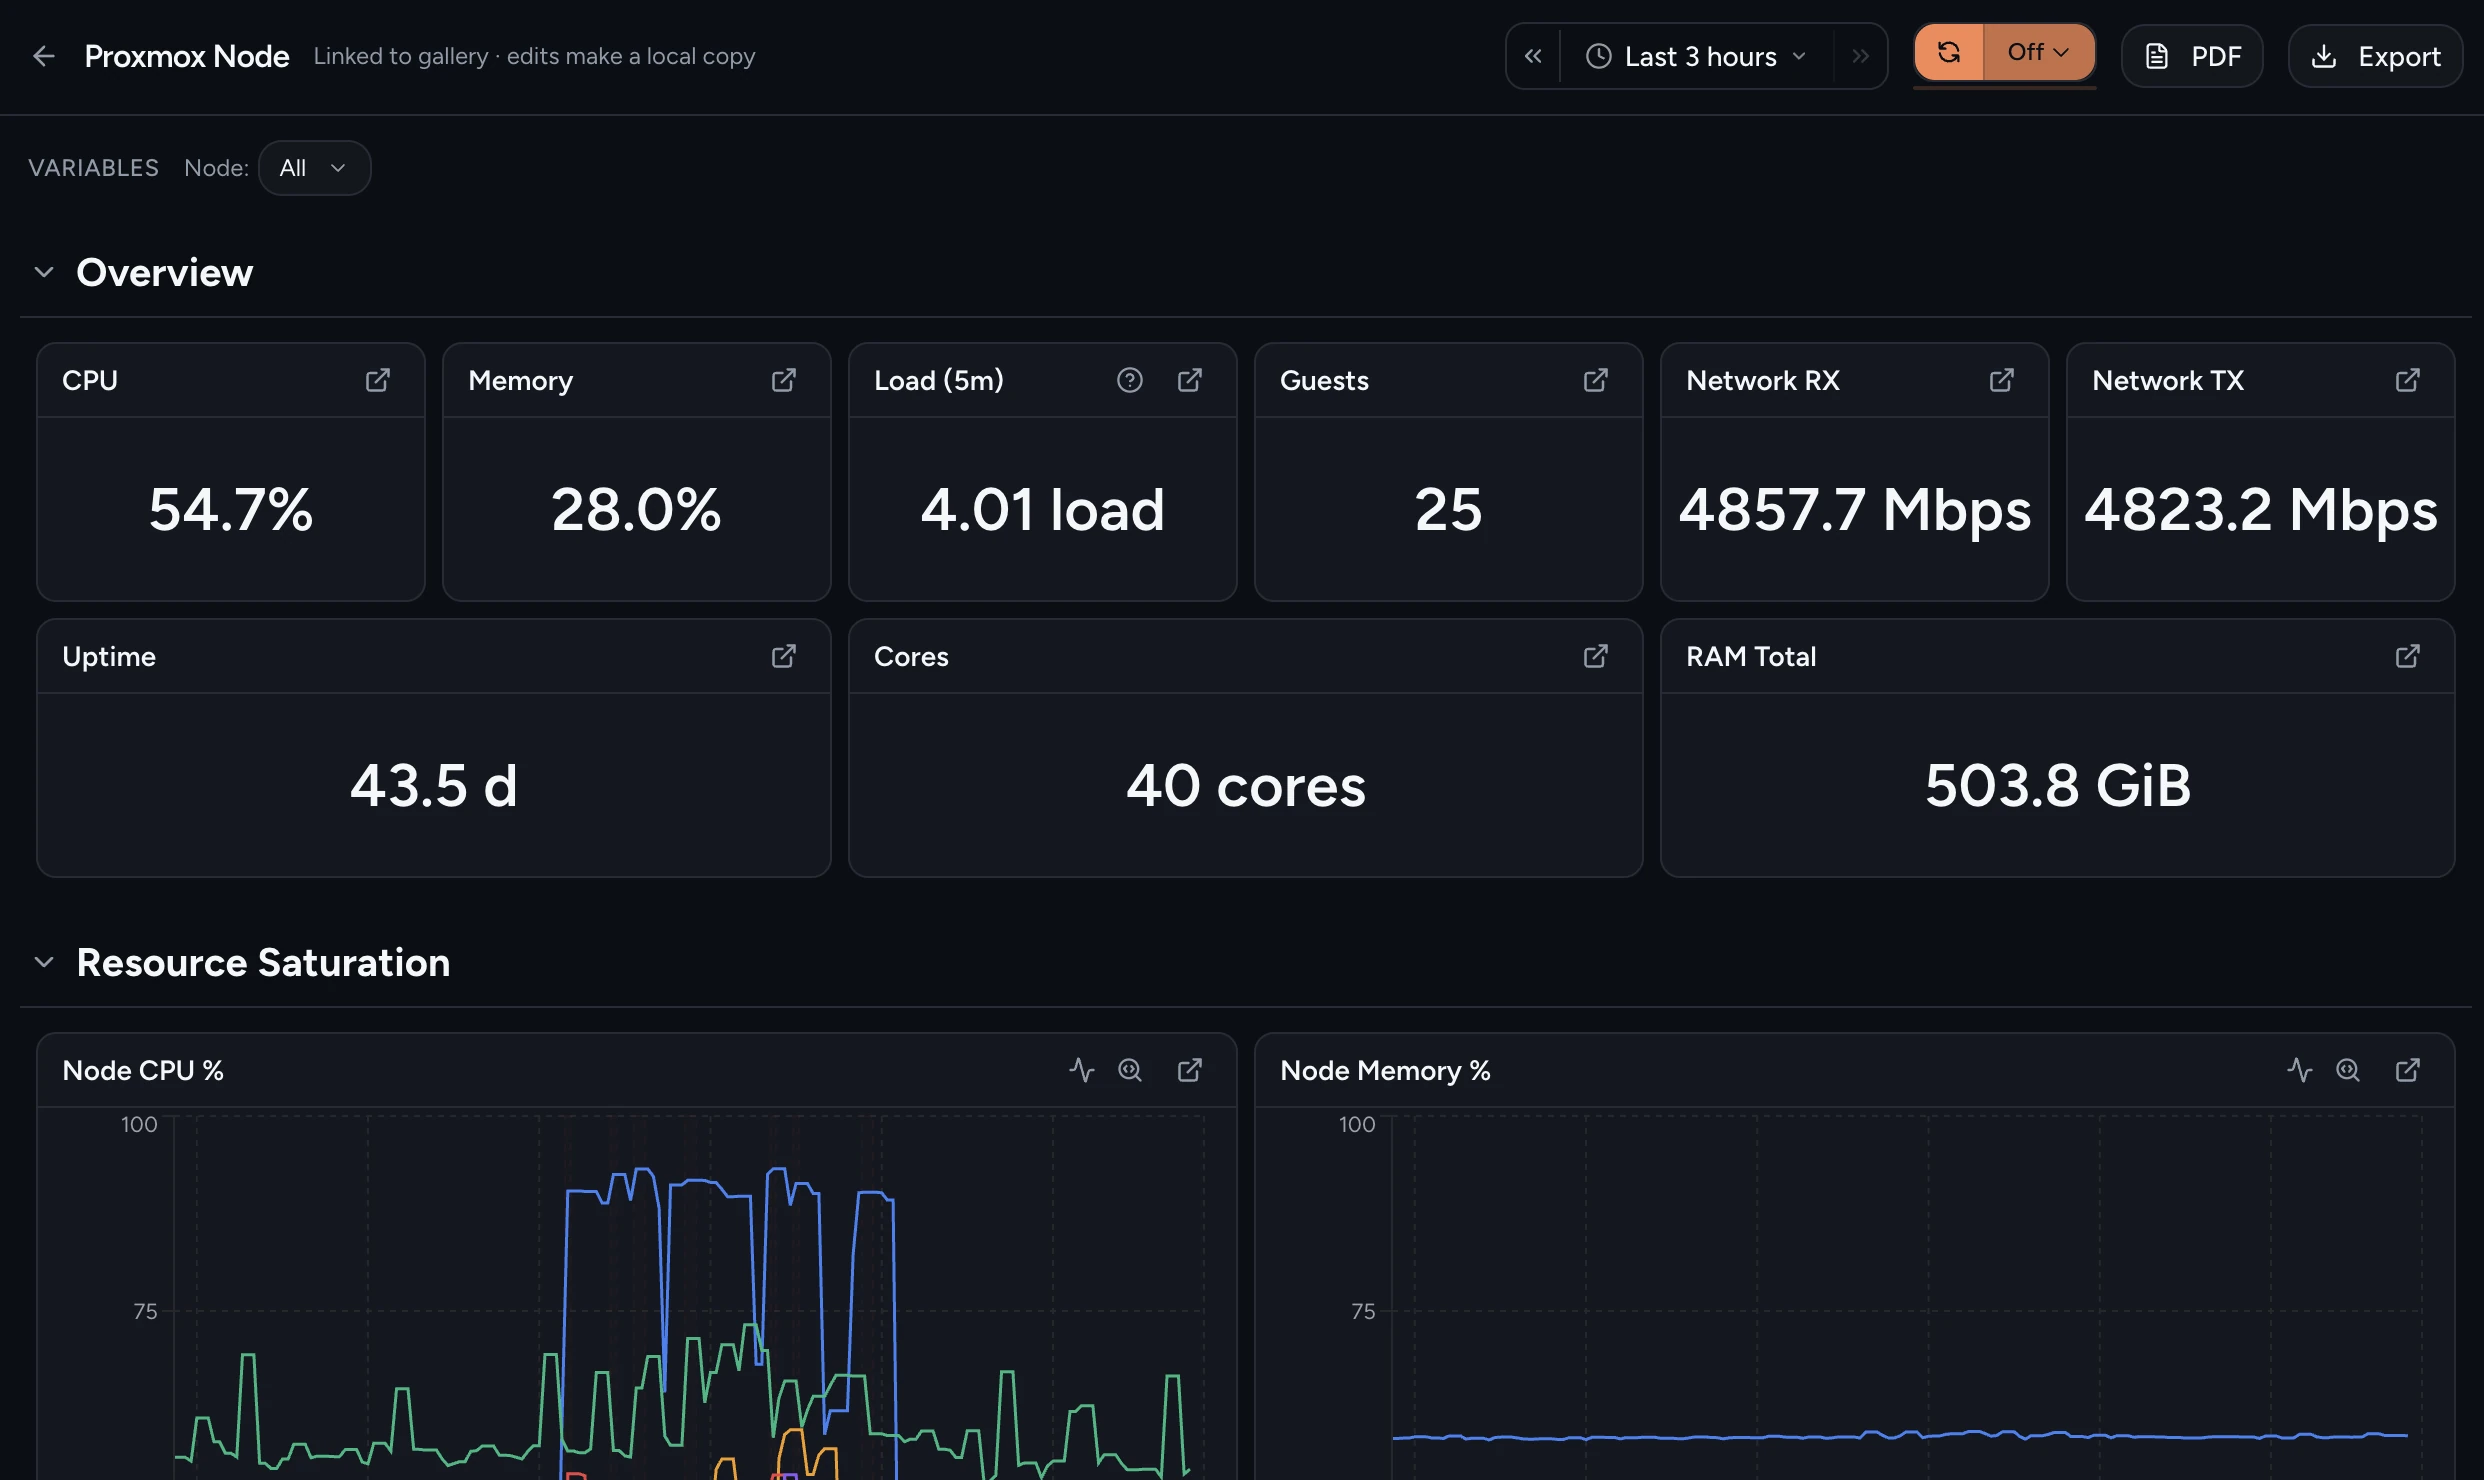
Per-pool used % and free GiB tiles for every storage pool on every node, with cluster CPU and memory rolled up underneath.
Scrape the Proxmox VE Exporter and your PVE node exporters into an OpenTelemetry Collector that writes to your own S3, GCS, or Azure Blob bucket — no vendor storage in the path. Per-guest SLOs, qemu- and LXC-level depth, and cluster rollups are on the moment the first object lands.