Skip to content
Home

AWS Observability

Fleet dashboards for AWS services.

  • Amazon ECS
  • Amazon EKS
  • Amazon MSK
  • Amazon RDS
  • Amazon SQS
  • Elastic Load Balancing
  • NAT Gateway (VPC)

View your AWS fleet. CloudWatch metrics flow directly into Cardinal — no additional services to run.

Six Service Families - Fleet First, Then Drill Down

Triage dashboards, not a wall of graphs.

Click any card to enlarge · esc to close

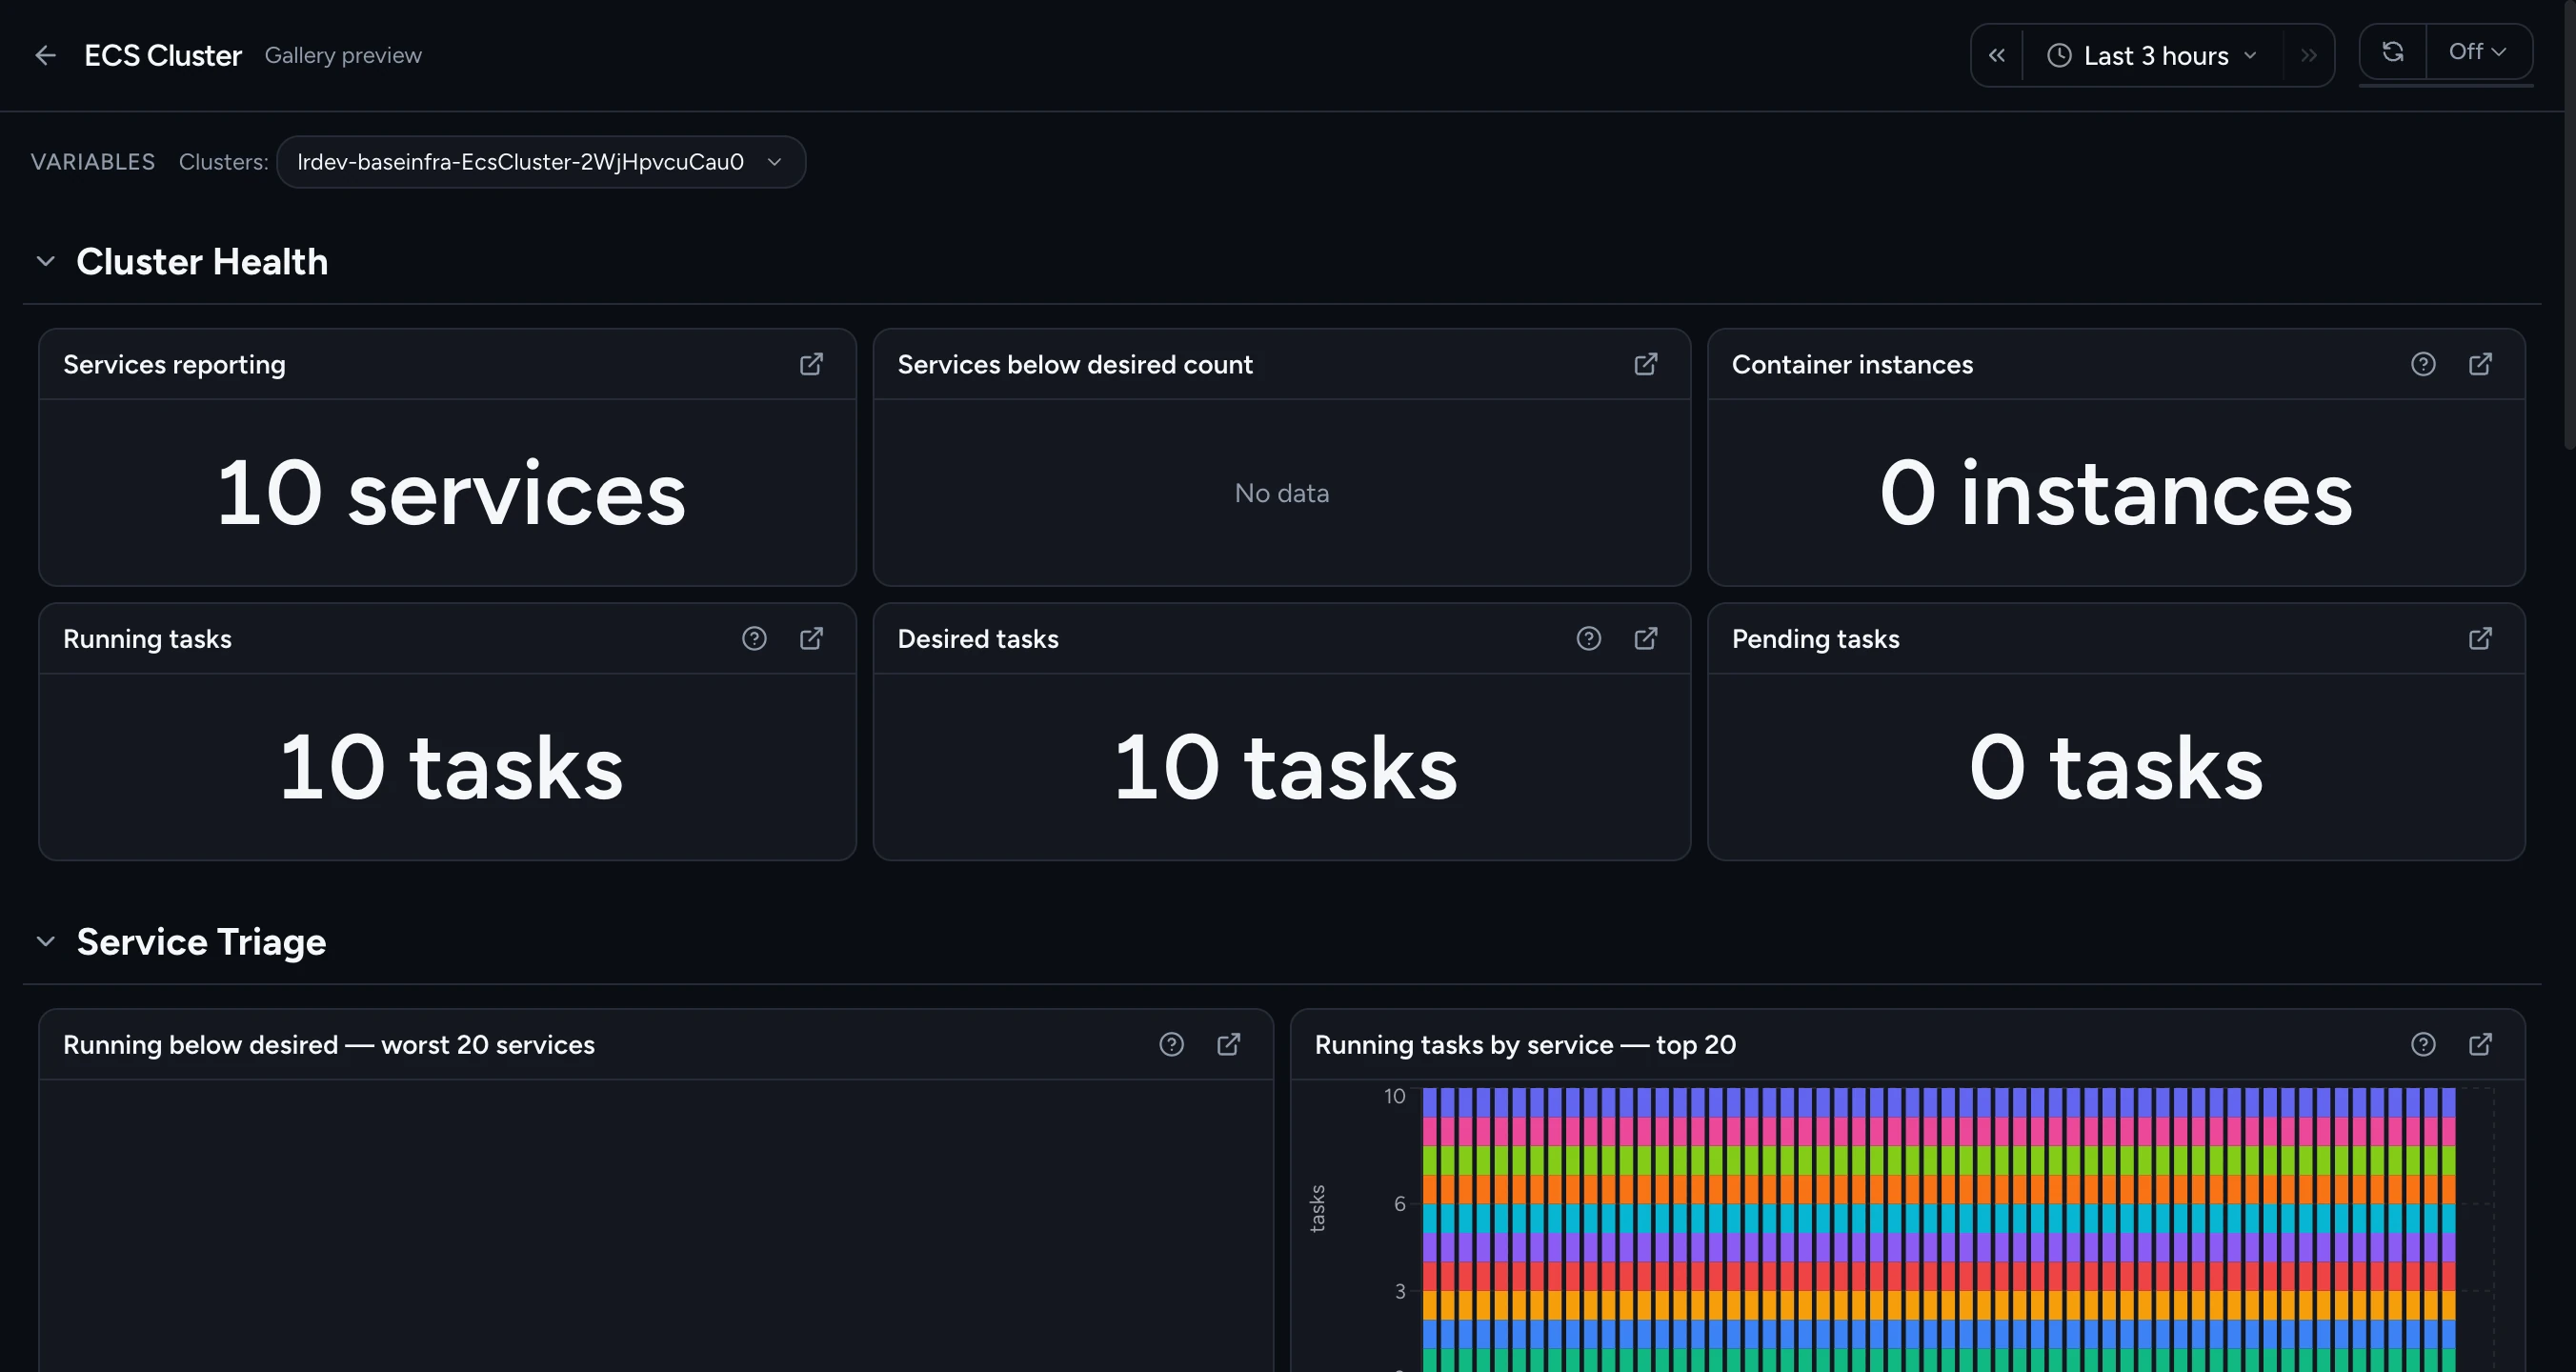
Cardinal ECS Cluster dashboard: Cluster Health tiles (Services reporting, Services below desired count, Container instances, Running / Desired / Pending tasks) above a Service Triage section with running tasks ranked by service.

01 · Amazon ECS

Which service in this cluster is unhealthy?

Fleet → cluster → service. Running-vs-desired gaps ranked across every service, task counts by state, CPU and memory against their reservations, EC2 container-instance capacity, and Fargate ephemeral storage.
Cardinal ECS Cluster dashboard: Cluster Health tiles (Services reporting, Services below desired count, Container instances, Running / Desired / Pending tasks) above a Service Triage section with running tasks ranked by service.
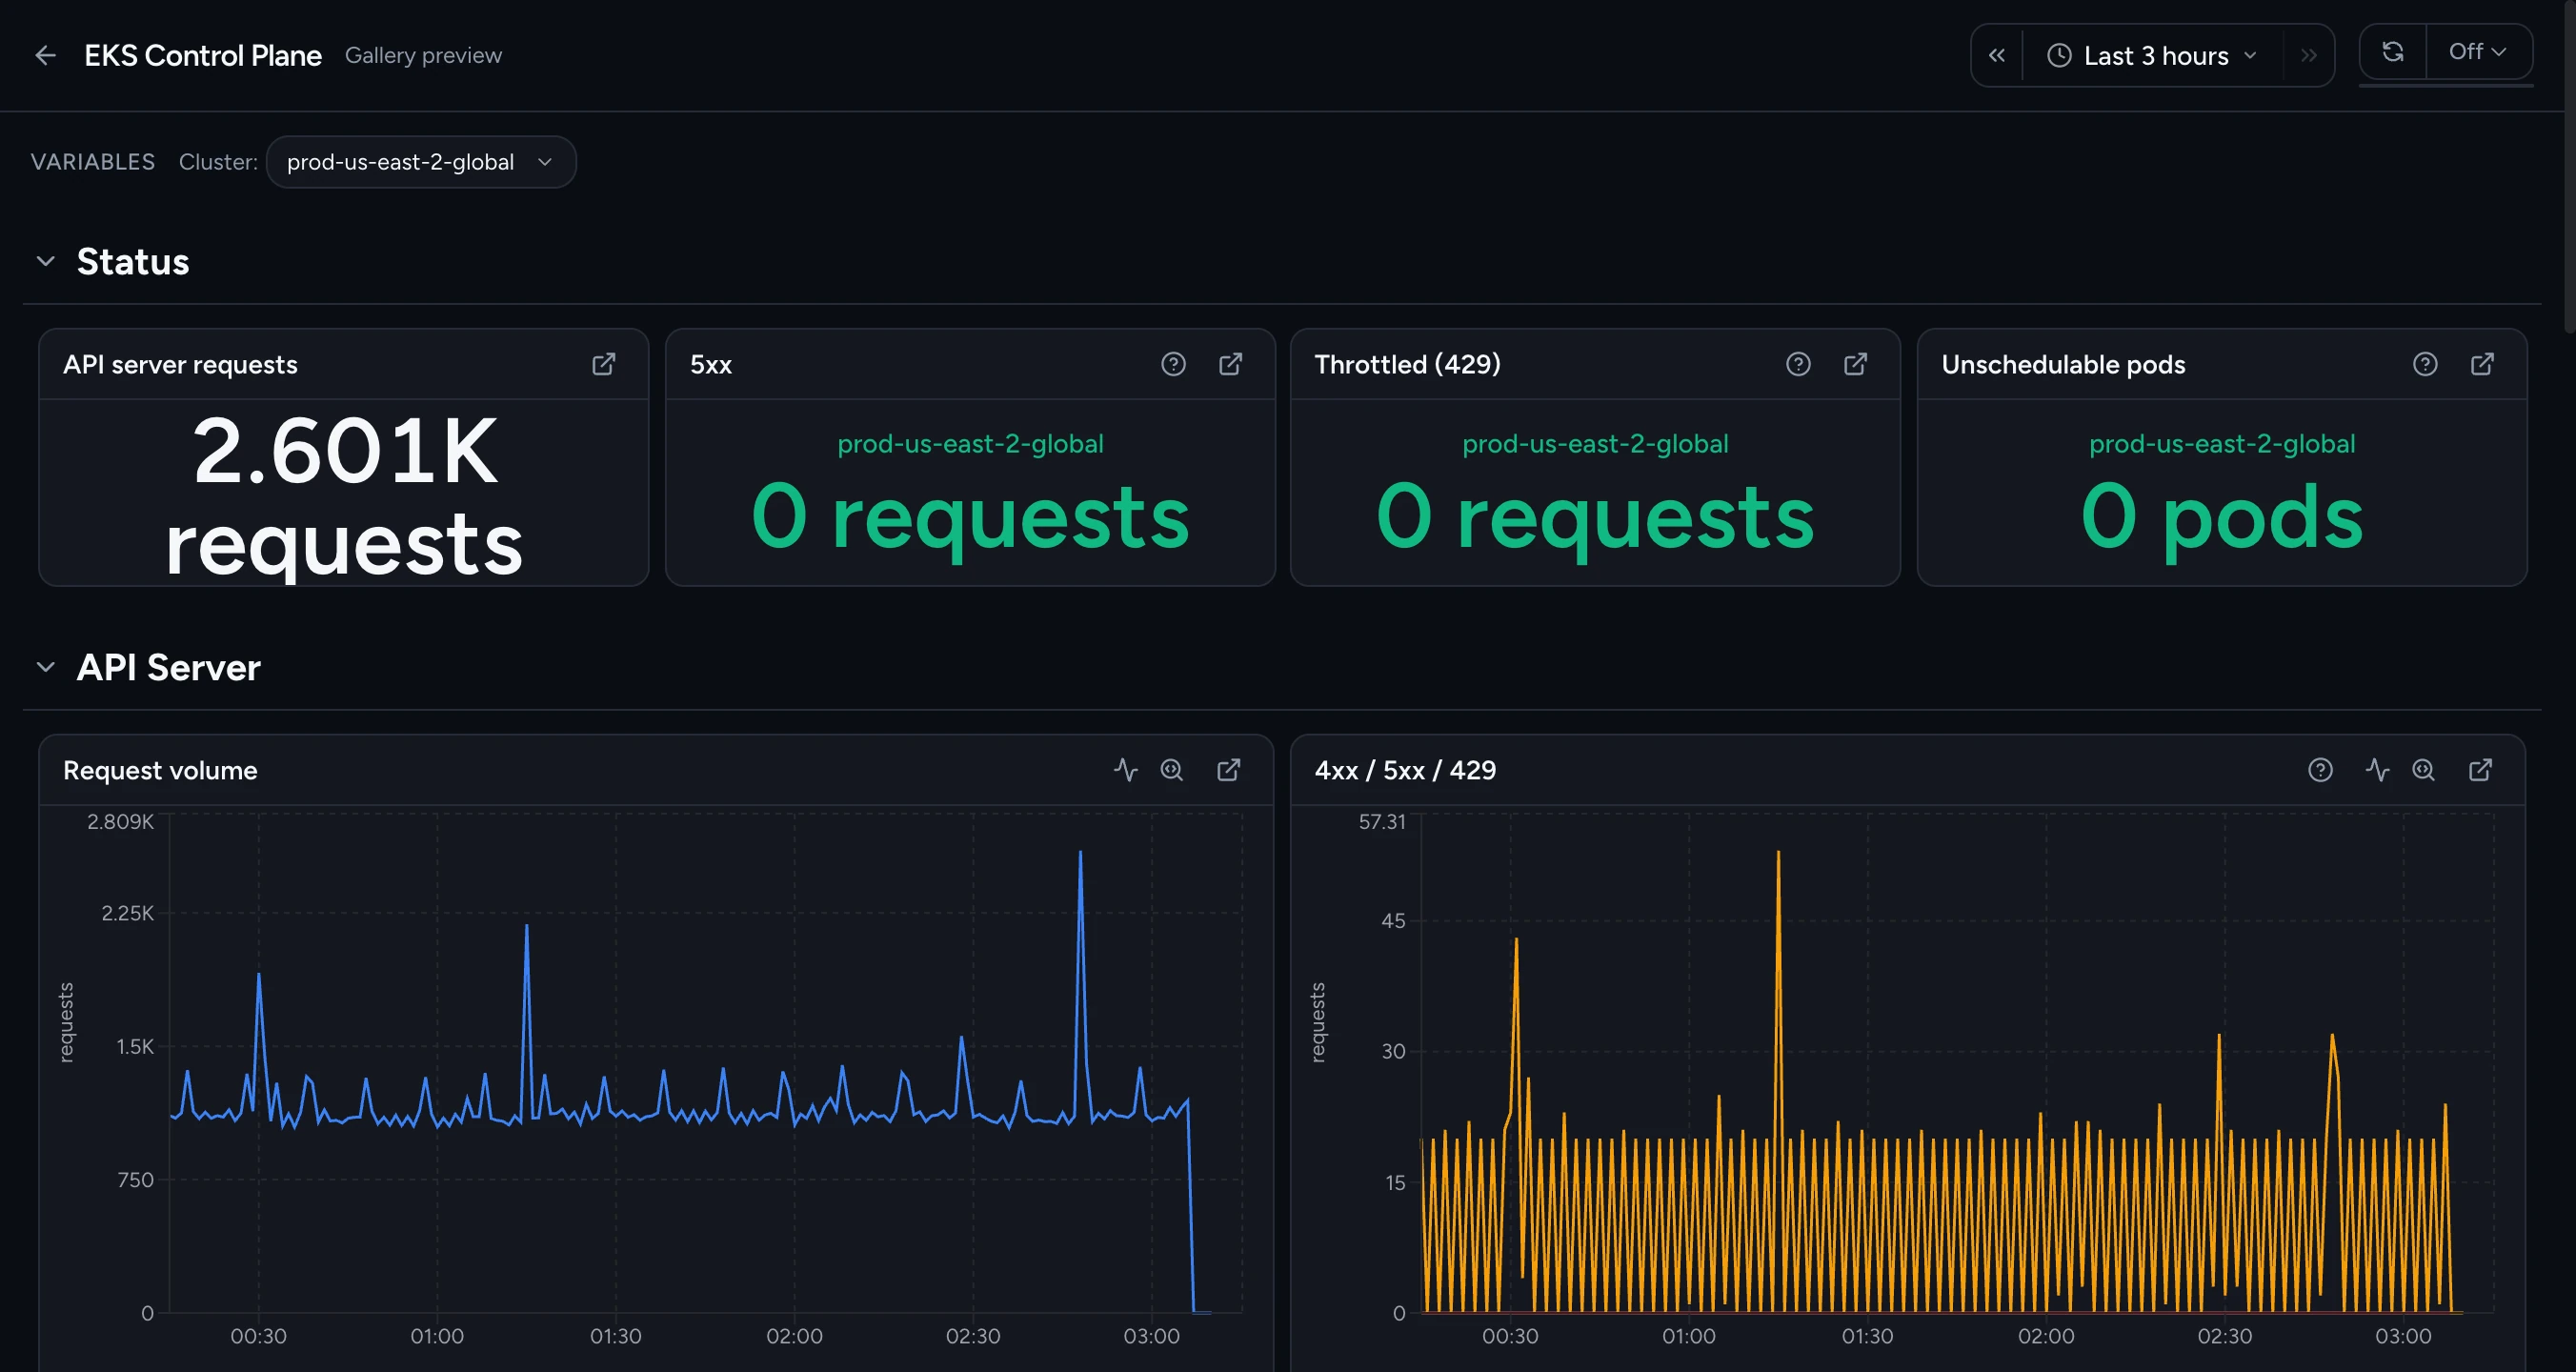
Cardinal EKS Control Plane dashboard: Status tiles for API server requests, 5xx, Throttled (429), and Unschedulable pods, above API Server request volume and 4xx/5xx/429 time series.

02 · Amazon EKS

The control plane AWS runs — watched anyway.

API server traffic and latency by verb, 5xx and 429 throttling, flow-control concurrency, admission webhooks, scheduler queues, and etcd size — plus a fleet view ranking every cluster by errors, throttling, LIST latency, and unschedulable pods.

Cardinal EKS Control Plane dashboard: Status tiles for API server requests, 5xx, Throttled (429), and Unschedulable pods, above API Server request volume and 4xx/5xx/429 time series.
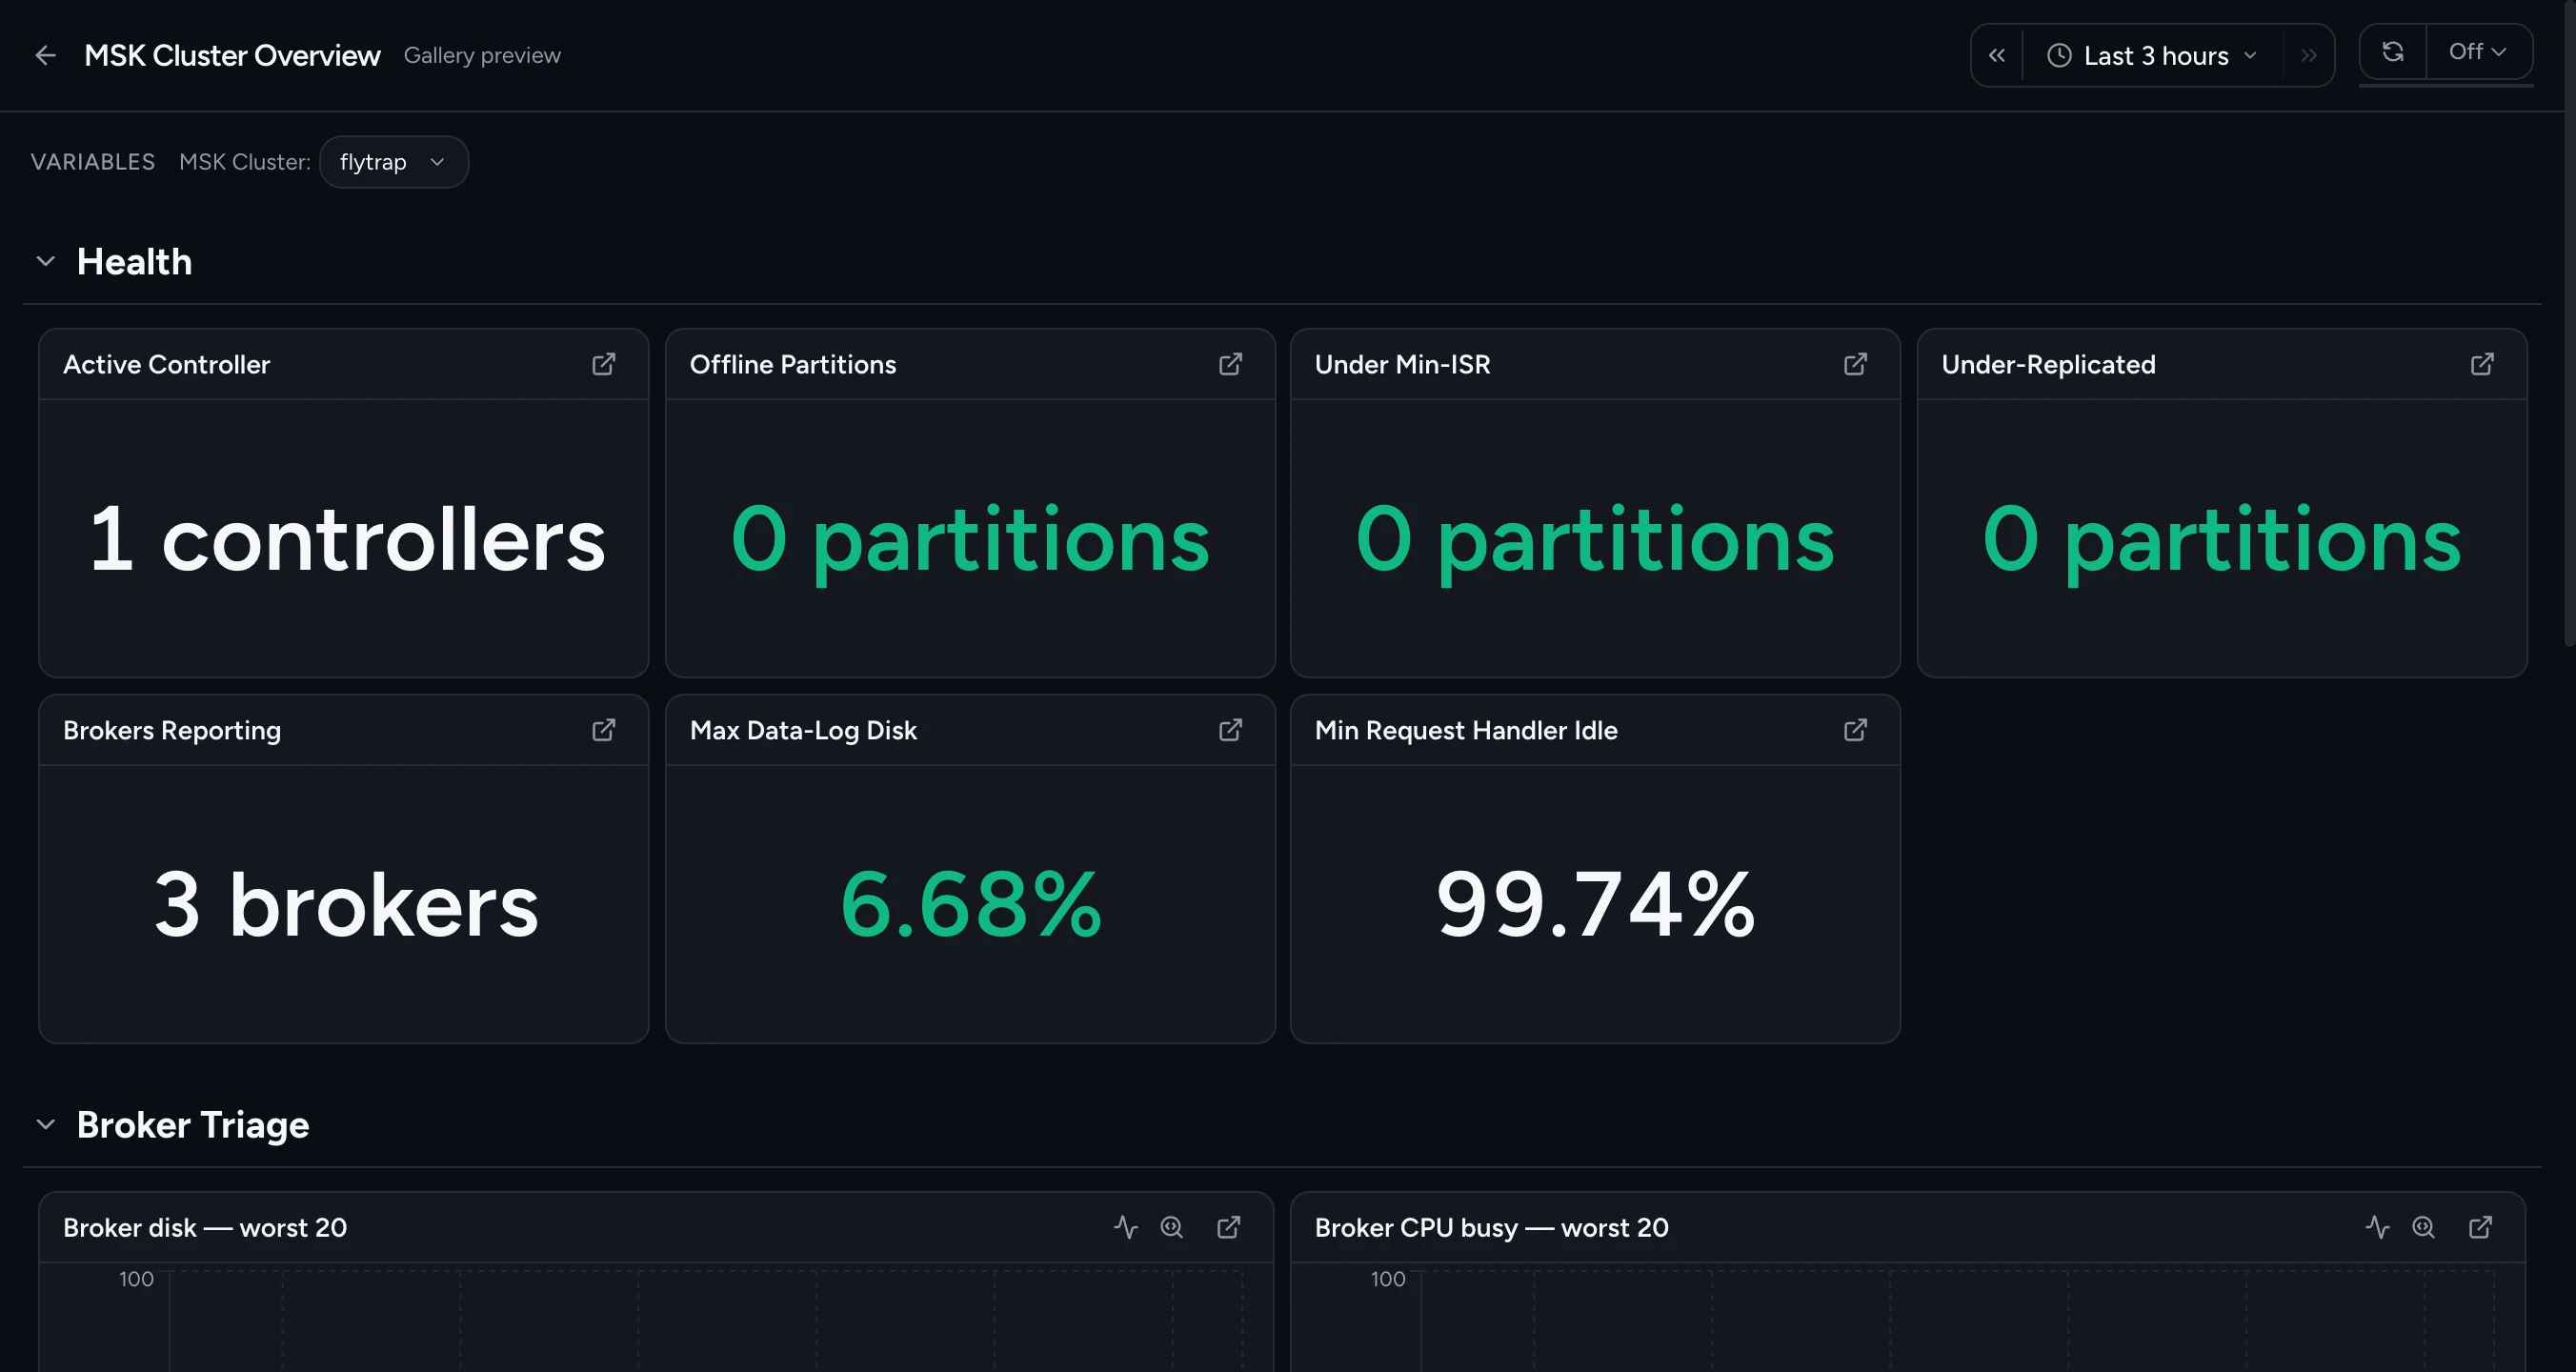
Cardinal MSK Cluster Overview dashboard: Health tiles for Active Controller, Offline Partitions, Under Min-ISR, Under-Replicated, Brokers Reporting, Max Data-Log Disk, and Min Request Handler Idle, above a Broker Triage section.

03 · Amazon MSK

From cluster health to the lagging consumer.

Five dashboards: fleet → cluster → broker, topic, and consumer group. Offline and under-replicated partitions, broker disk and request-handler idle, produce/fetch latency, and consumer lag ranked so the worst branch is one click deep.

Cardinal MSK Cluster Overview dashboard: Health tiles for Active Controller, Offline Partitions, Under Min-ISR, Under-Replicated, Brokers Reporting, Max Data-Log Disk, and Min Request Handler Idle, above a Broker Triage section.
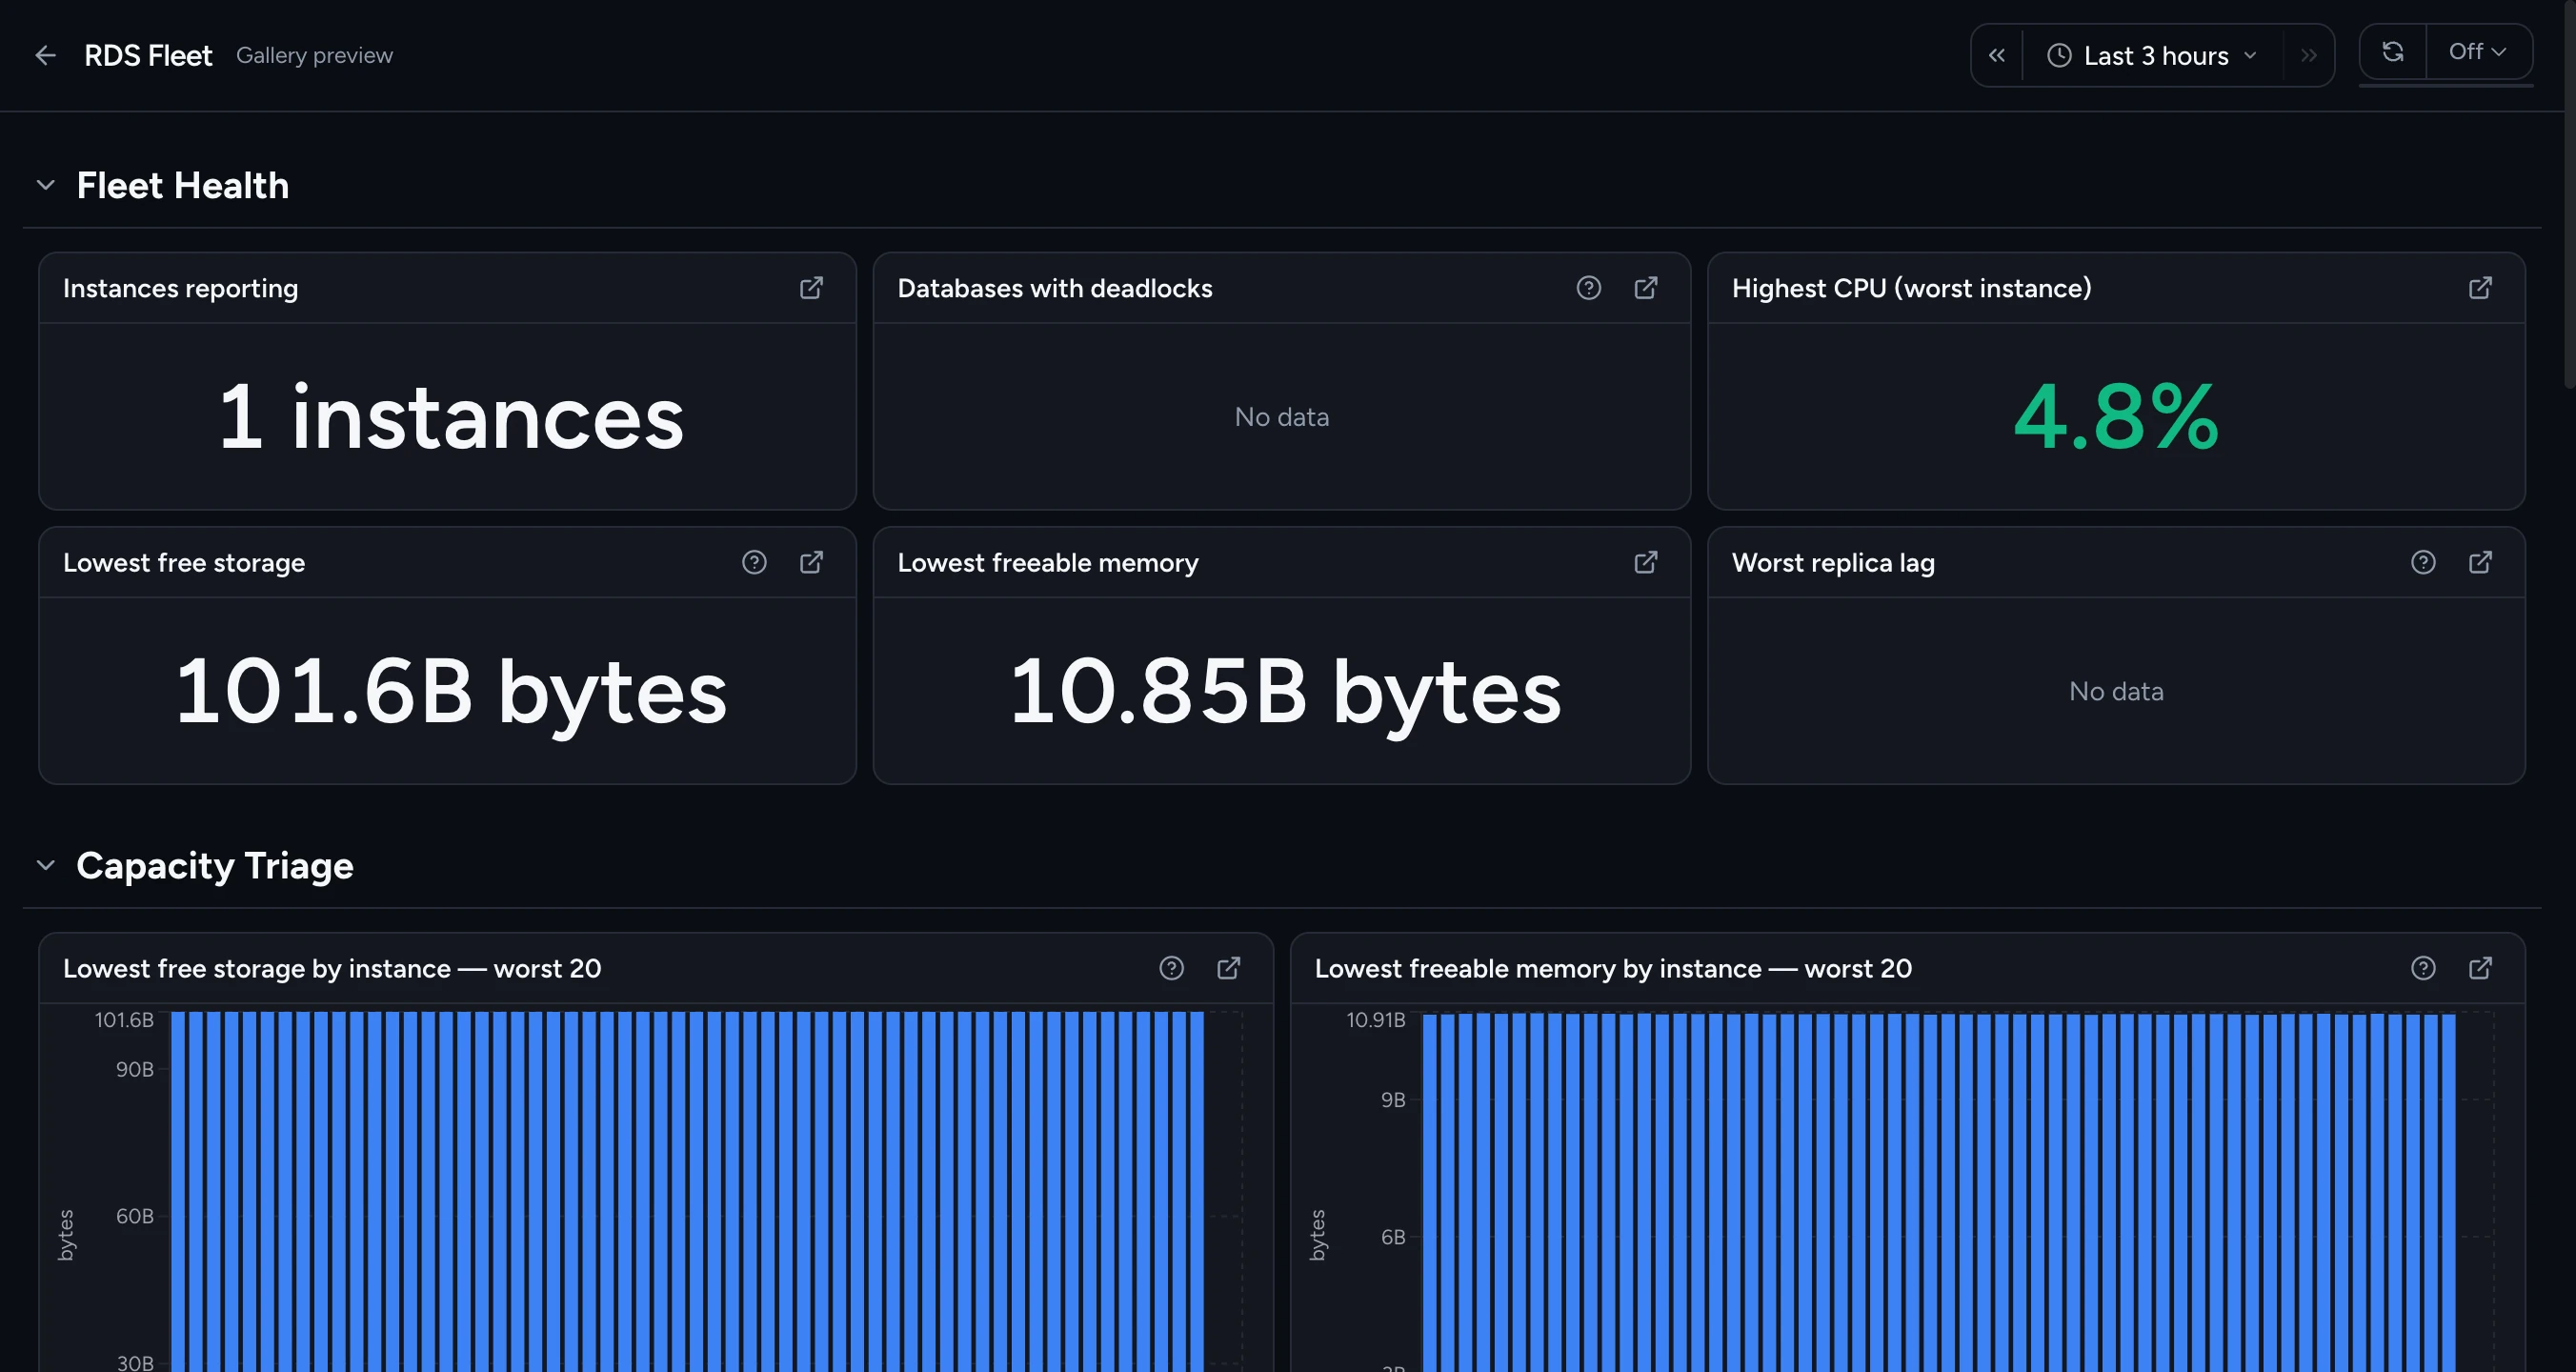
Cardinal RDS Fleet dashboard: Fleet Health tiles (Instances reporting, Databases with deadlocks, Highest CPU, Lowest free storage, Lowest freeable memory, Worst replica lag) above Capacity Triage rankings by instance.

04 · Amazon RDS · fleet

Which database needs attention first?

Free storage, freeable memory, CPU, connections, I/O latency, disk queue, and replica lag ranked across every RDS and Aurora instance — the worst instance surfaces before anyone files a ticket.

Cardinal RDS Fleet dashboard: Fleet Health tiles (Instances reporting, Databases with deadlocks, Highest CPU, Lowest free storage, Lowest freeable memory, Worst replica lag) above Capacity Triage rankings by instance.
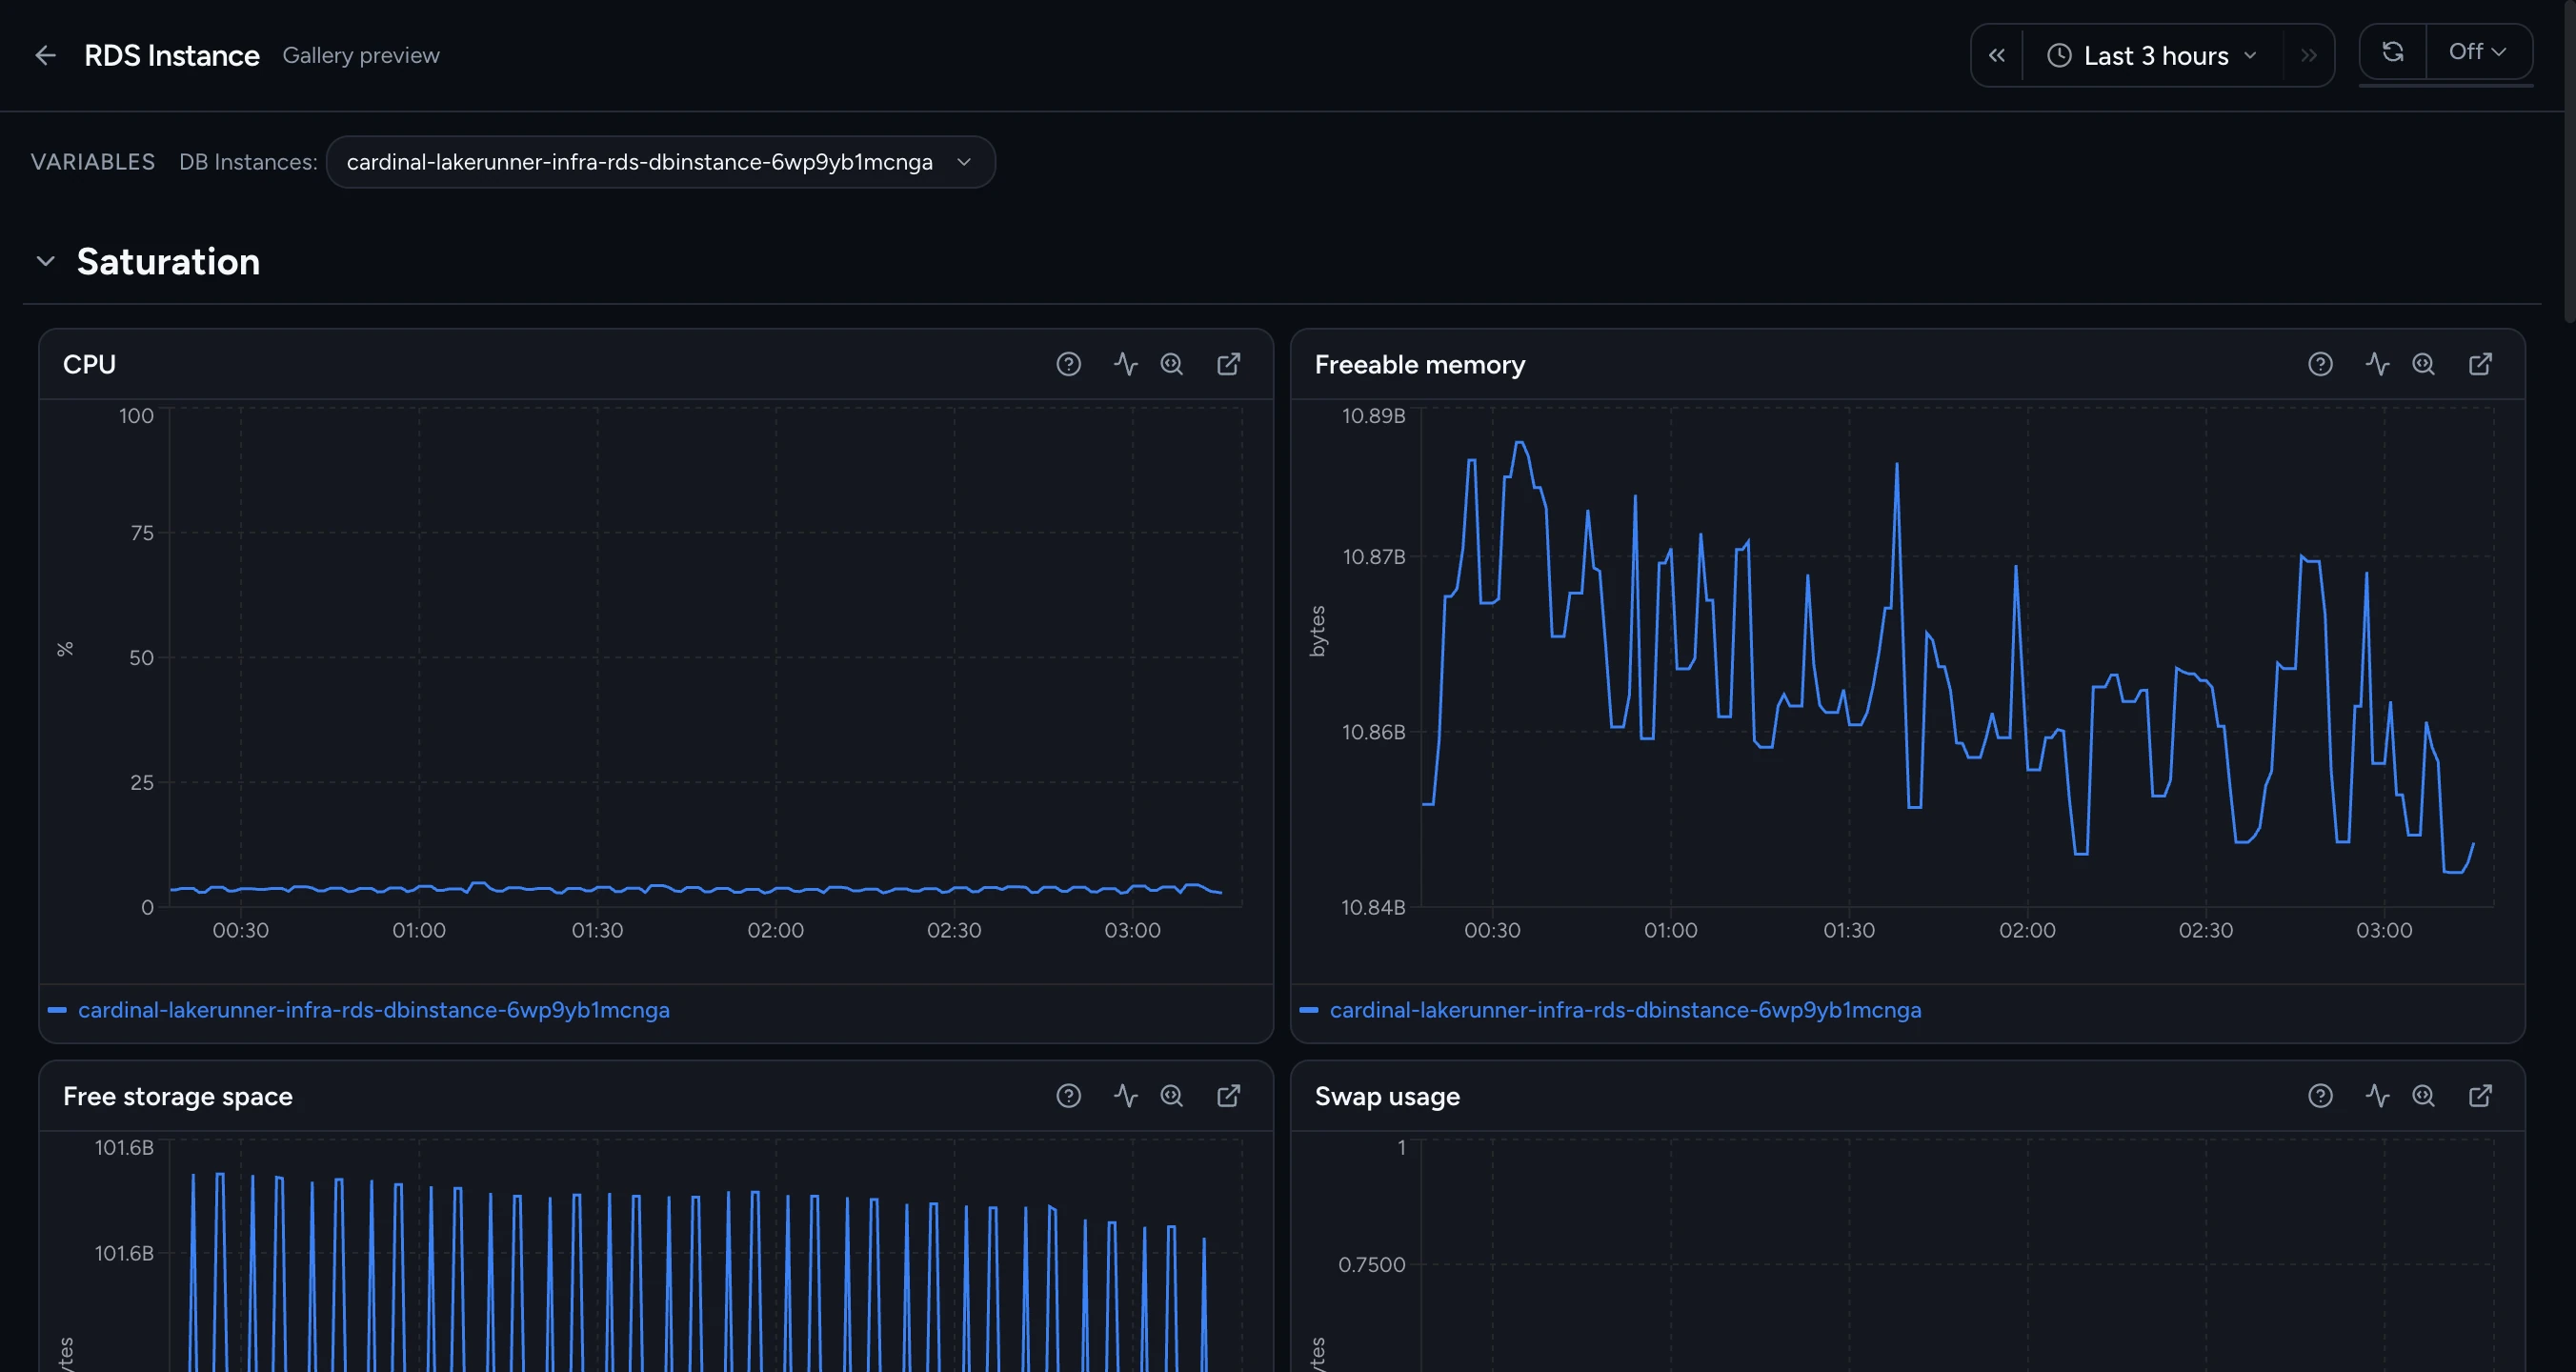
Cardinal RDS Instance dashboard: Saturation section with CPU, Freeable memory, Free storage space, and Swap usage time series for a selected DB instance.

05 · Amazon RDS · instance

What's wrong with this database?

CPU, memory, swap, storage trend, IOPS and throughput, read/write latency, queue depth, connections, replica lag, and burst balance — one instance, everything that pages you, on one screen.

Cardinal RDS Instance dashboard: Saturation section with CPU, Freeable memory, Free storage space, and Swap usage time series for a selected DB instance.
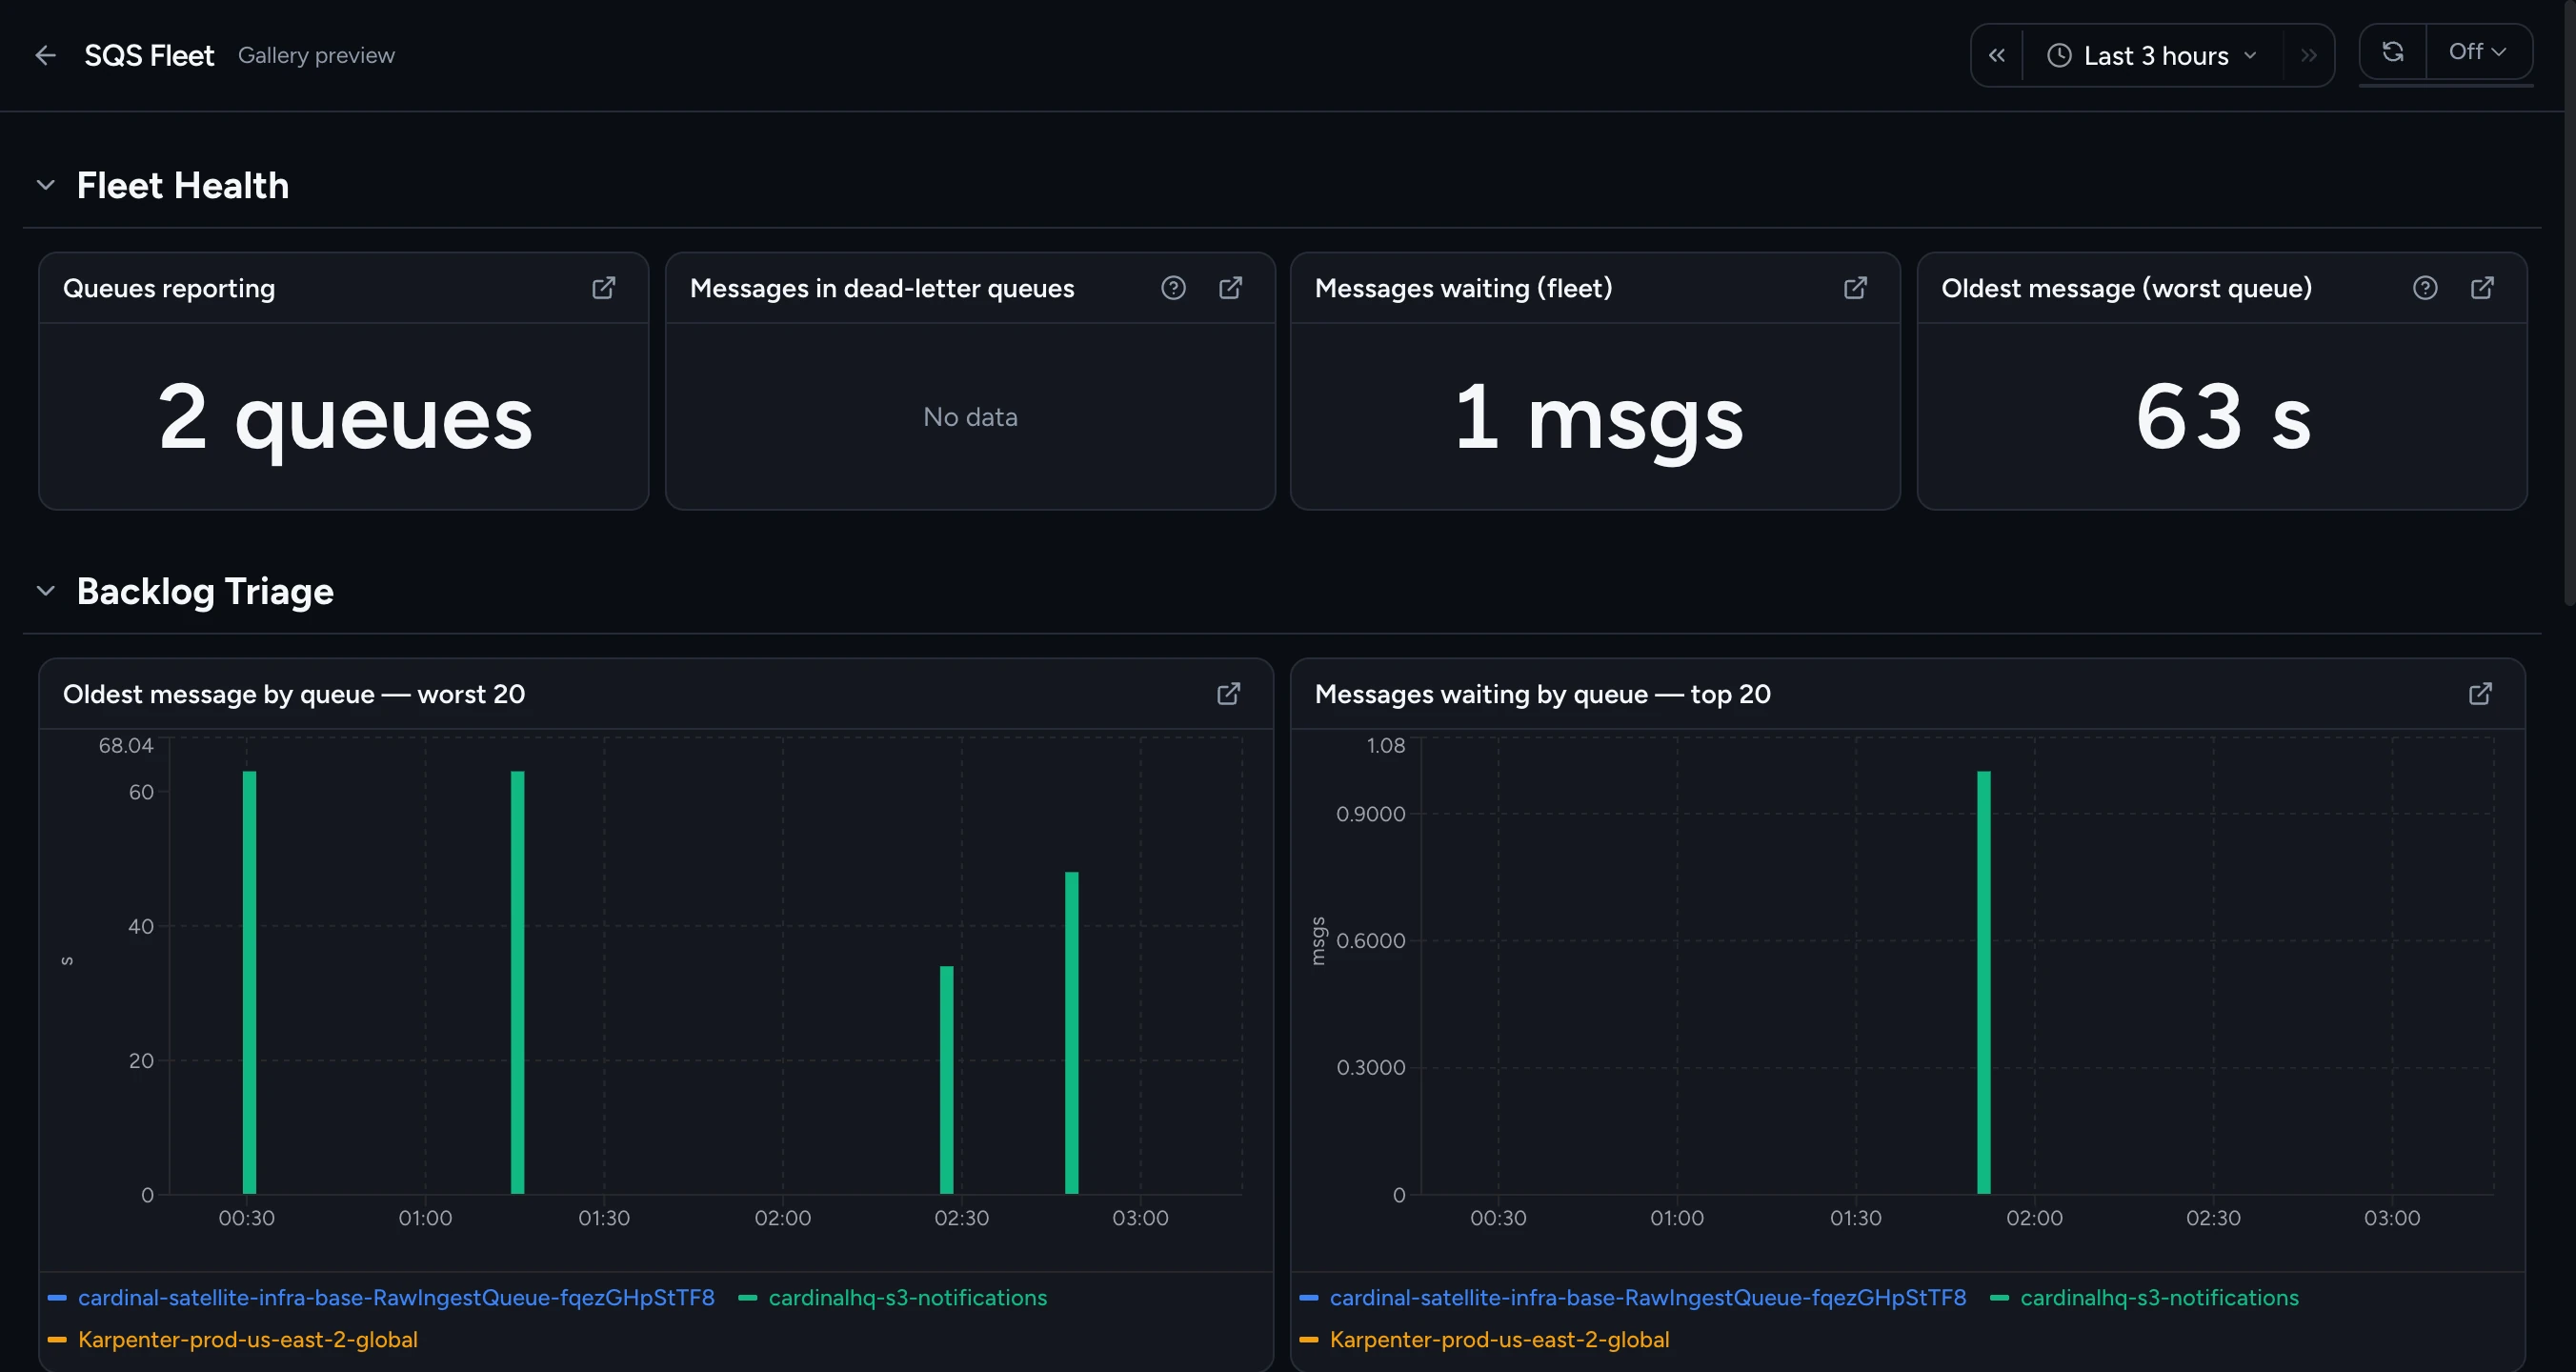
Cardinal SQS Fleet dashboard: Fleet Health tiles (Queues reporting, Messages in dead-letter queues, Messages waiting, Oldest message) above Backlog Triage charts ranking oldest message and messages waiting by queue.

06 · Amazon SQS

Which queue is backing up?

Oldest message age, waiting and in-flight depth, dead-letter backlog, and empty-receive waste ranked across every queue — then a side-by-side view of producer/consumer flow to see whether the fix is upstream or down.

Cardinal SQS Fleet dashboard: Fleet Health tiles (Queues reporting, Messages in dead-letter queues, Messages waiting, Oldest message) above Backlog Triage charts ranking oldest message and messages waiting by queue.
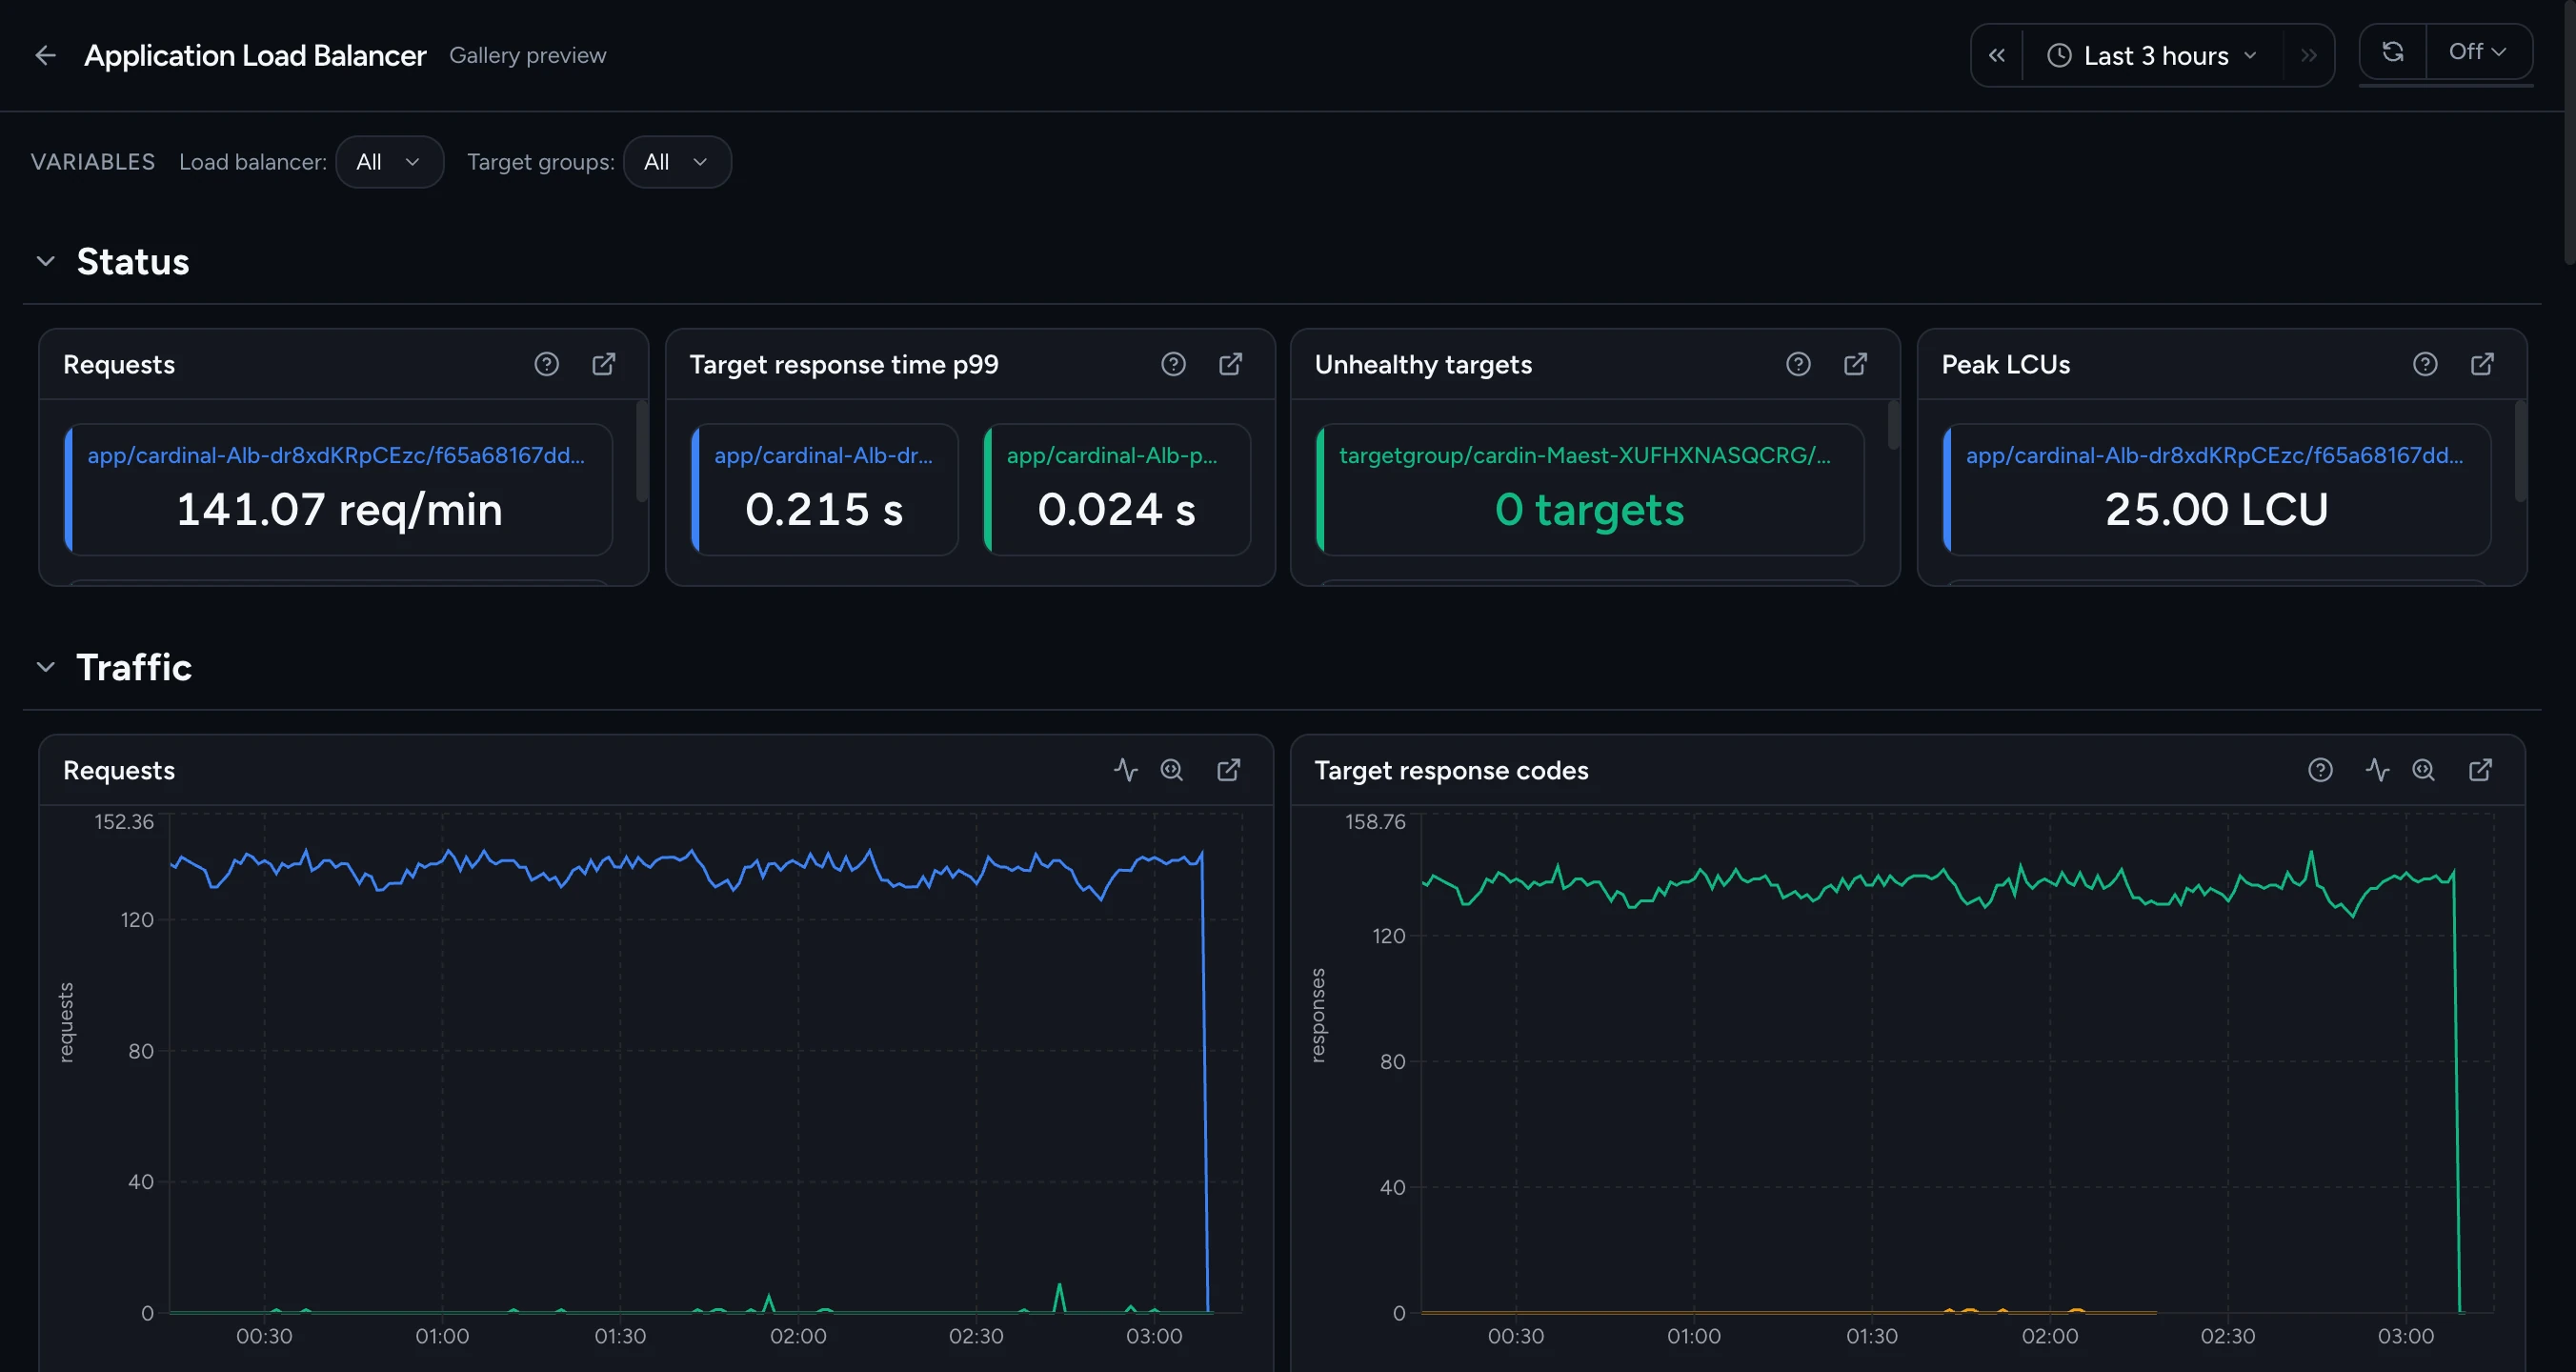
Cardinal Application Load Balancer dashboard: Status tiles for Requests, Target response time p99, Unhealthy targets, and Peak LCUs, above Traffic time series for requests and target response codes.

07 · ALB + Classic ELB

Latency, target health — and the four LCU dimensions that set the bill.

Every query pinned to one CloudWatch dimension combination, so totals aren't silently multiplied by the rollups. Classic ELB adds the surge queue that fills before latency looks wrong, plus the estimated-ALB metrics AWS publishes to size a migration.

Cardinal Application Load Balancer dashboard: Status tiles for Requests, Target response time p99, Unhealthy targets, and Peak LCUs, above Traffic time series for requests and target response codes.
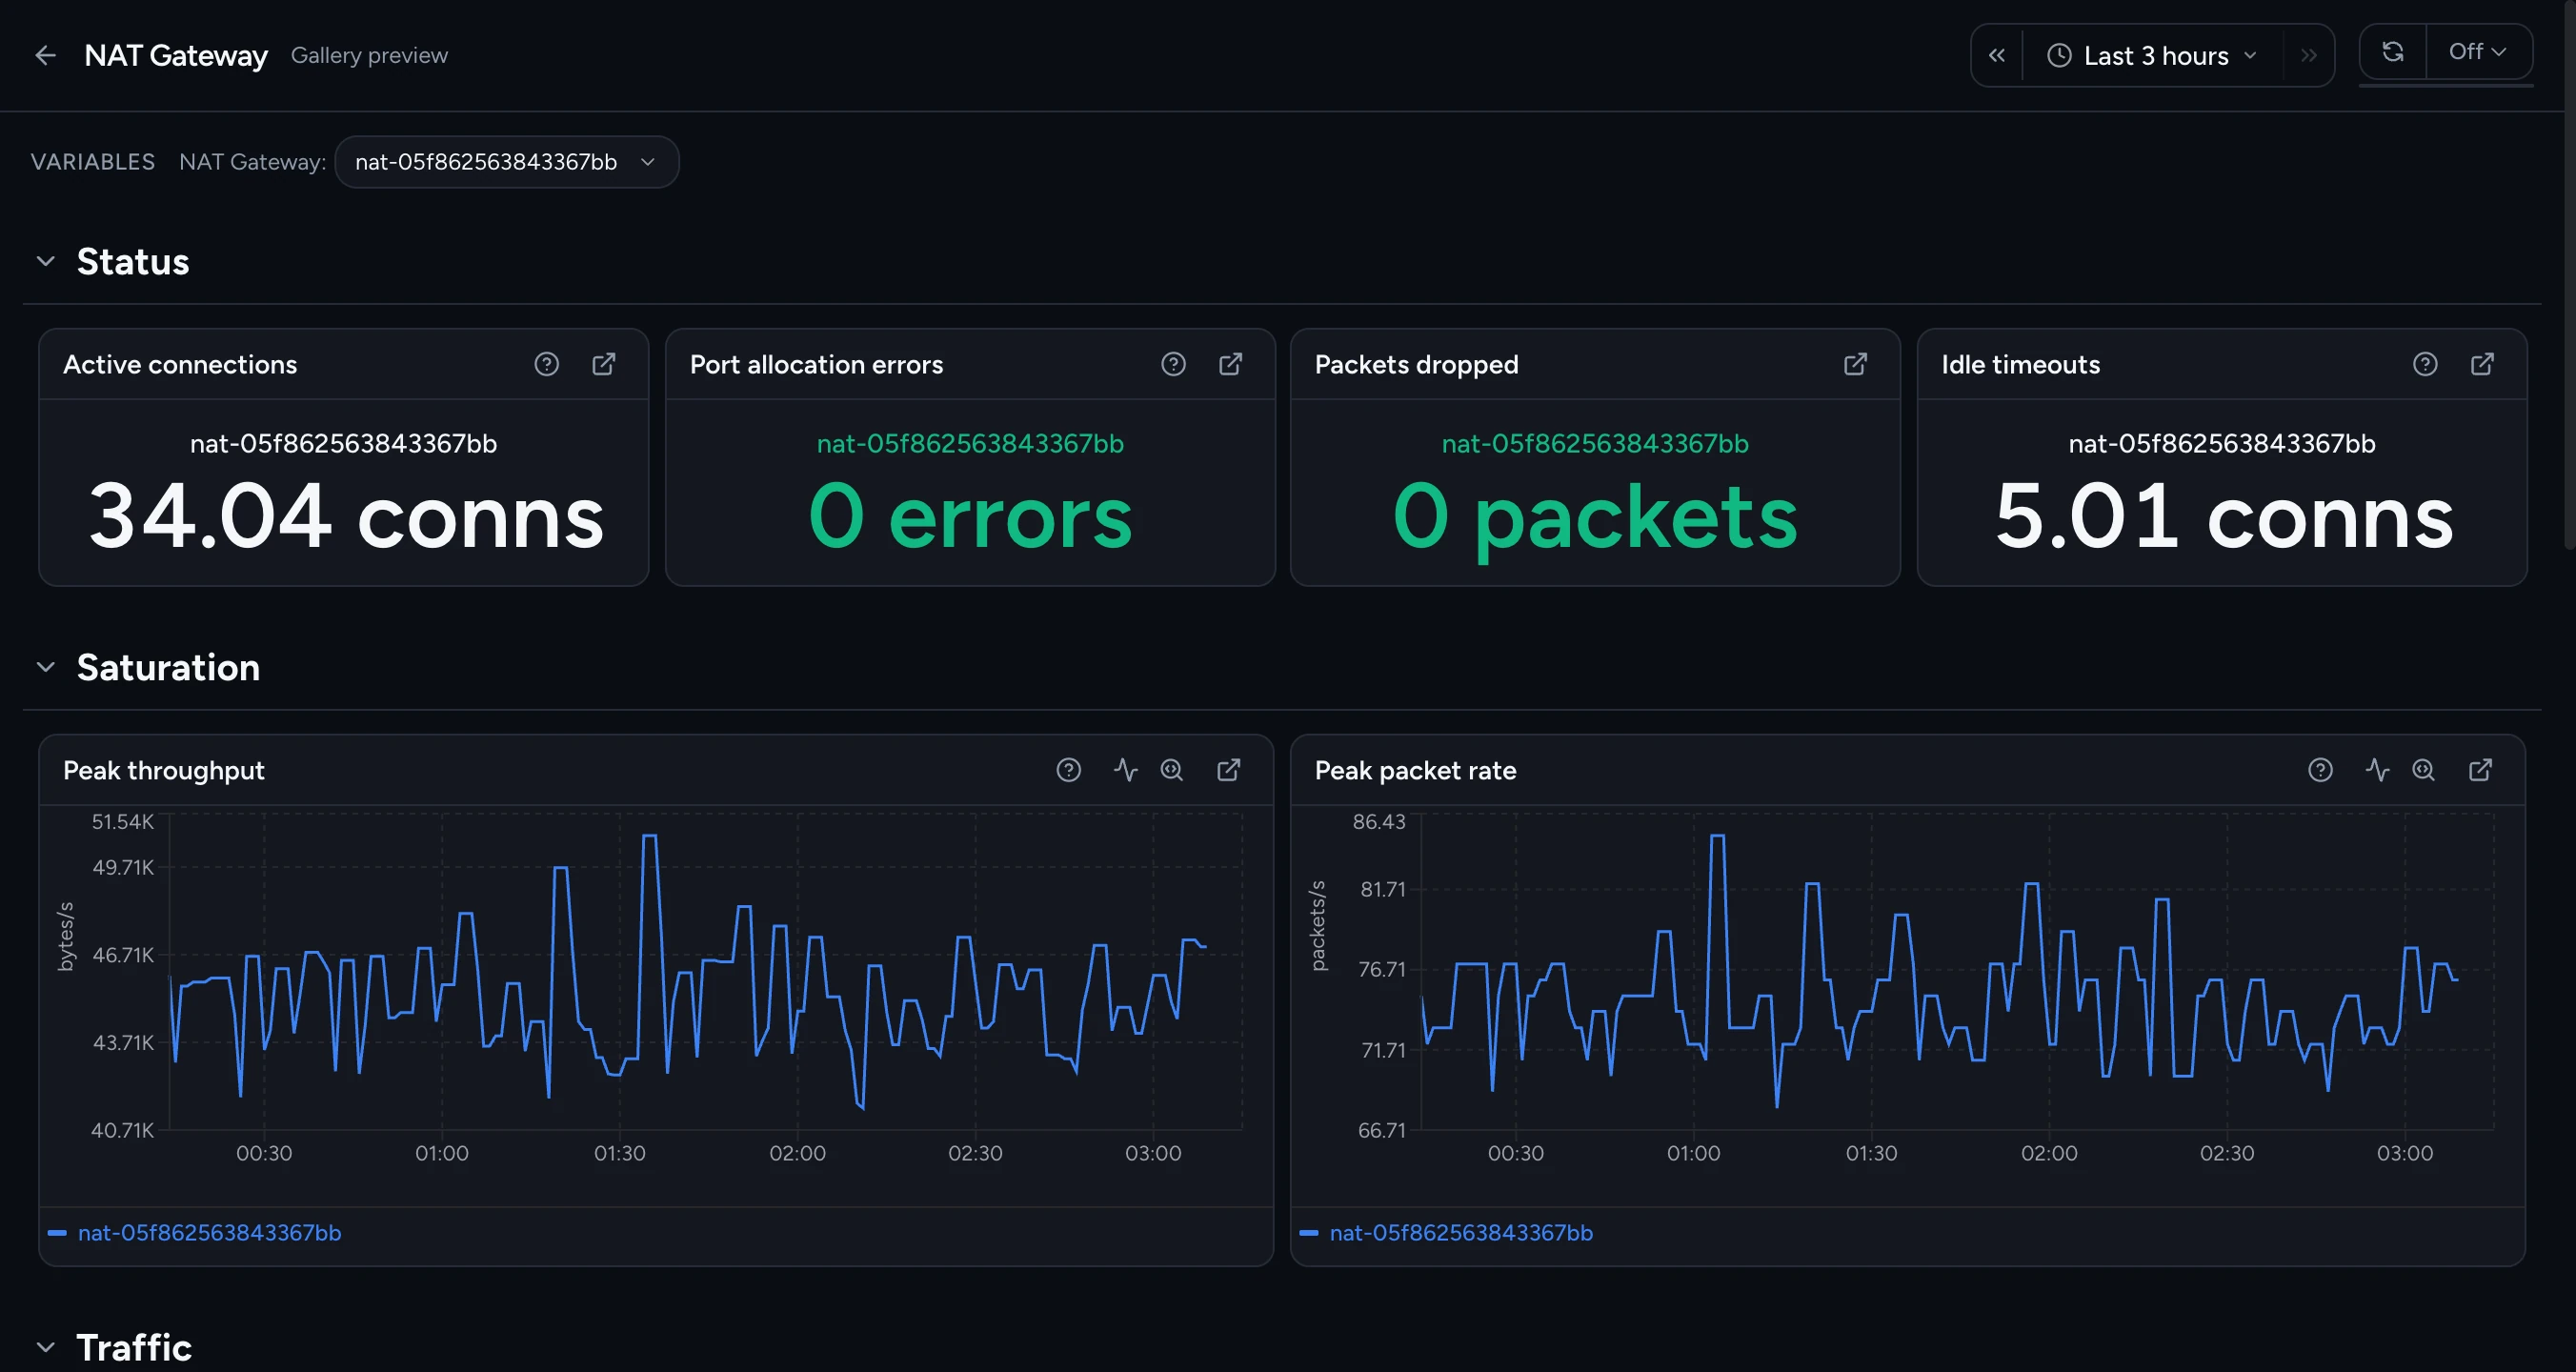
Cardinal NAT Gateway dashboard: Status tiles for Active connections, Port allocation errors, Packets dropped, and Idle timeouts, above Saturation time series for peak throughput and peak packet rate.

08 · NAT Gateway

Port exhaustion before it pages you.

Connection health against the 55k-per-destination port ceiling, throughput against the 100 Gbps limit, port-allocation errors, and dropped packets — per gateway, and ranked across the fleet.

Cardinal NAT Gateway dashboard: Status tiles for Active connections, Port allocation errors, Packets dropped, and Idle timeouts, above Saturation time series for peak throughput and peak packet rate.

Stream CloudWatch into your own bucket. Cardinal does the rest.

One CloudWatch Metric Stream, one Firehose, one S3 bucket you own — no vendor storage in the telemetry path. All 18 AWS dashboards are in the gallery the moment the first object lands: ECS, EKS, MSK, RDS, SQS, ALB, Classic ELB, and NAT Gateway.

  1. Step 1

    Create an account or log in to get started.

    Spin up a Cardinal workspace in under a minute. Free to start, no credit card.

    Create account / Log in
  2. Step 2

    Stream CloudWatch metrics — follow the walkthrough.

    CloudWatch Metric Streams → Firehose → your S3 bucket, with Terraform for both ends. The walkthrough covers the whole path.

    Follow the walkthrough
Compare vendors →