The First Observability Data Lake Built for Agents
Full-Fidelity Telemetry in your Object Storage—wrapped in an Agent Runtime with natural language investigation, deterministic troubleshooting skills, and evidence-backed answers.
No credit card required · See Agent Outcomes in ~10 minutes
 Founded by ex-Netflix engineers
 Backed by CRV
Full-Fidelity Telemetry · Object Storage
Trusted by teams at


Outcome Attribution for Agentic Engineering
Tokens are not outcomes.
Coding agents are the fastest-growing line item in engineering — and the least accounted for. Cardinal reads the OpenTelemetry your agents already emit and ties every session to the PR it produced, the merge that landed, and the dollars it took to get there.
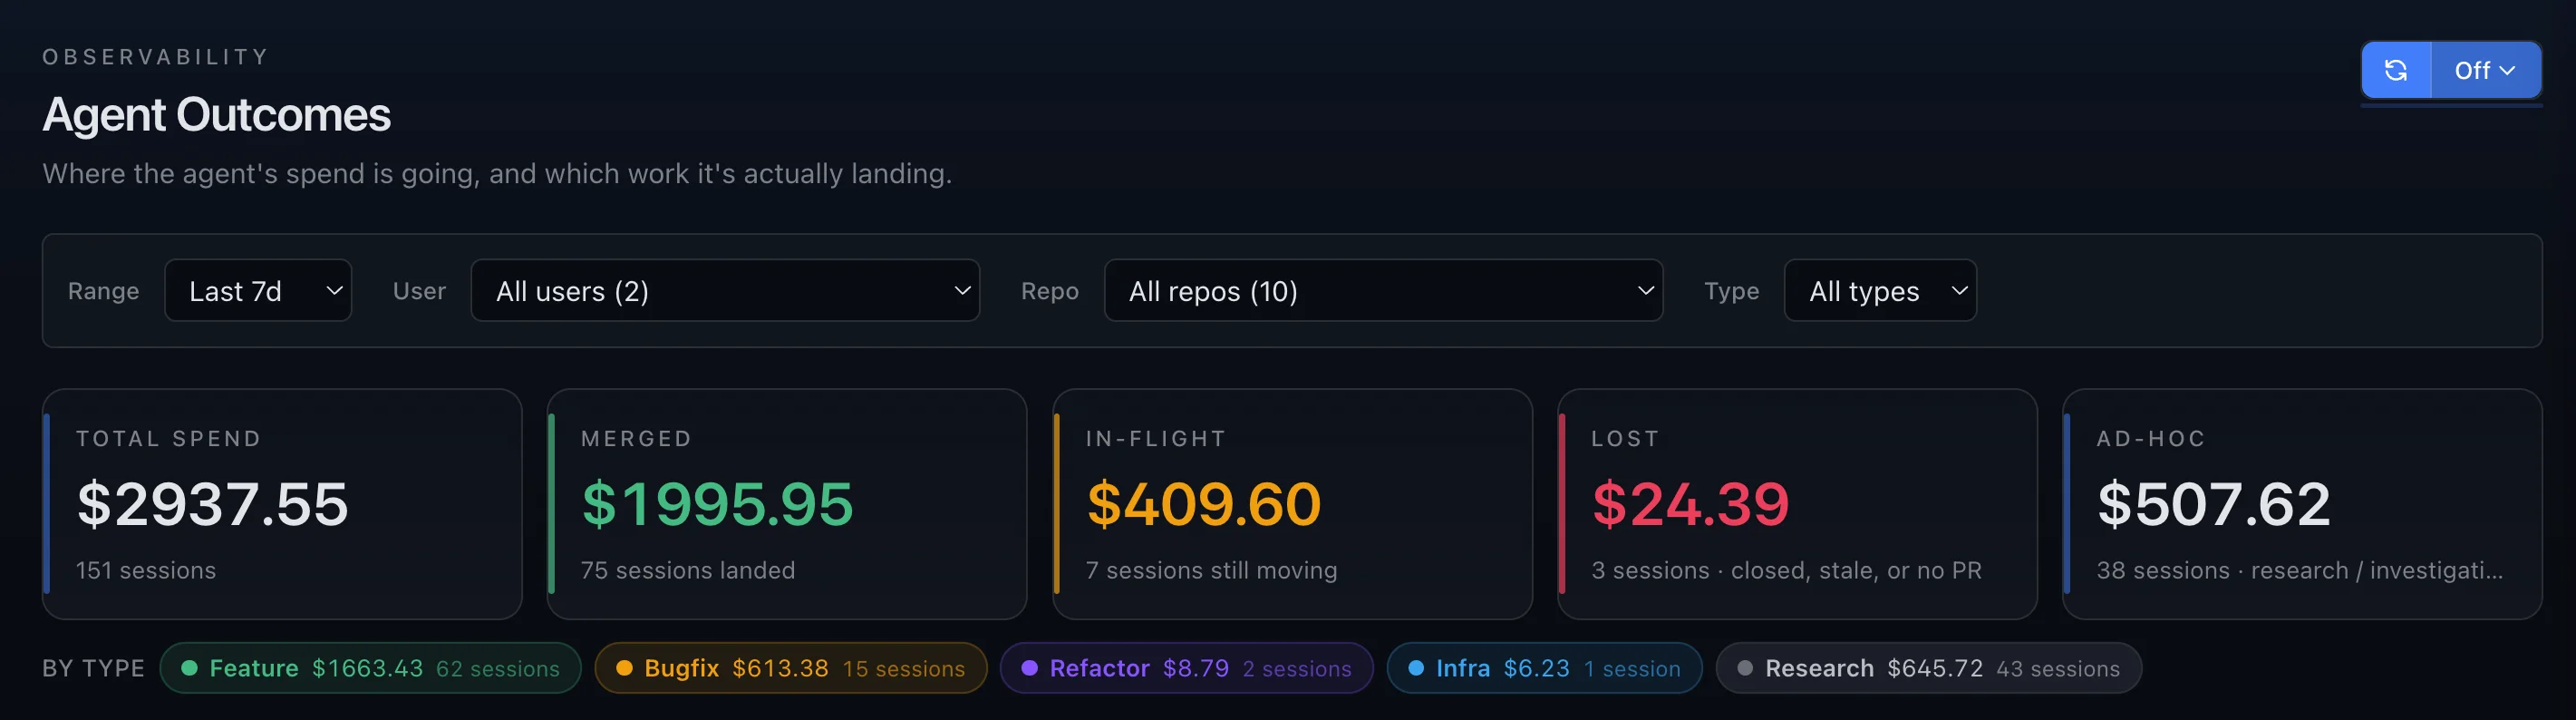
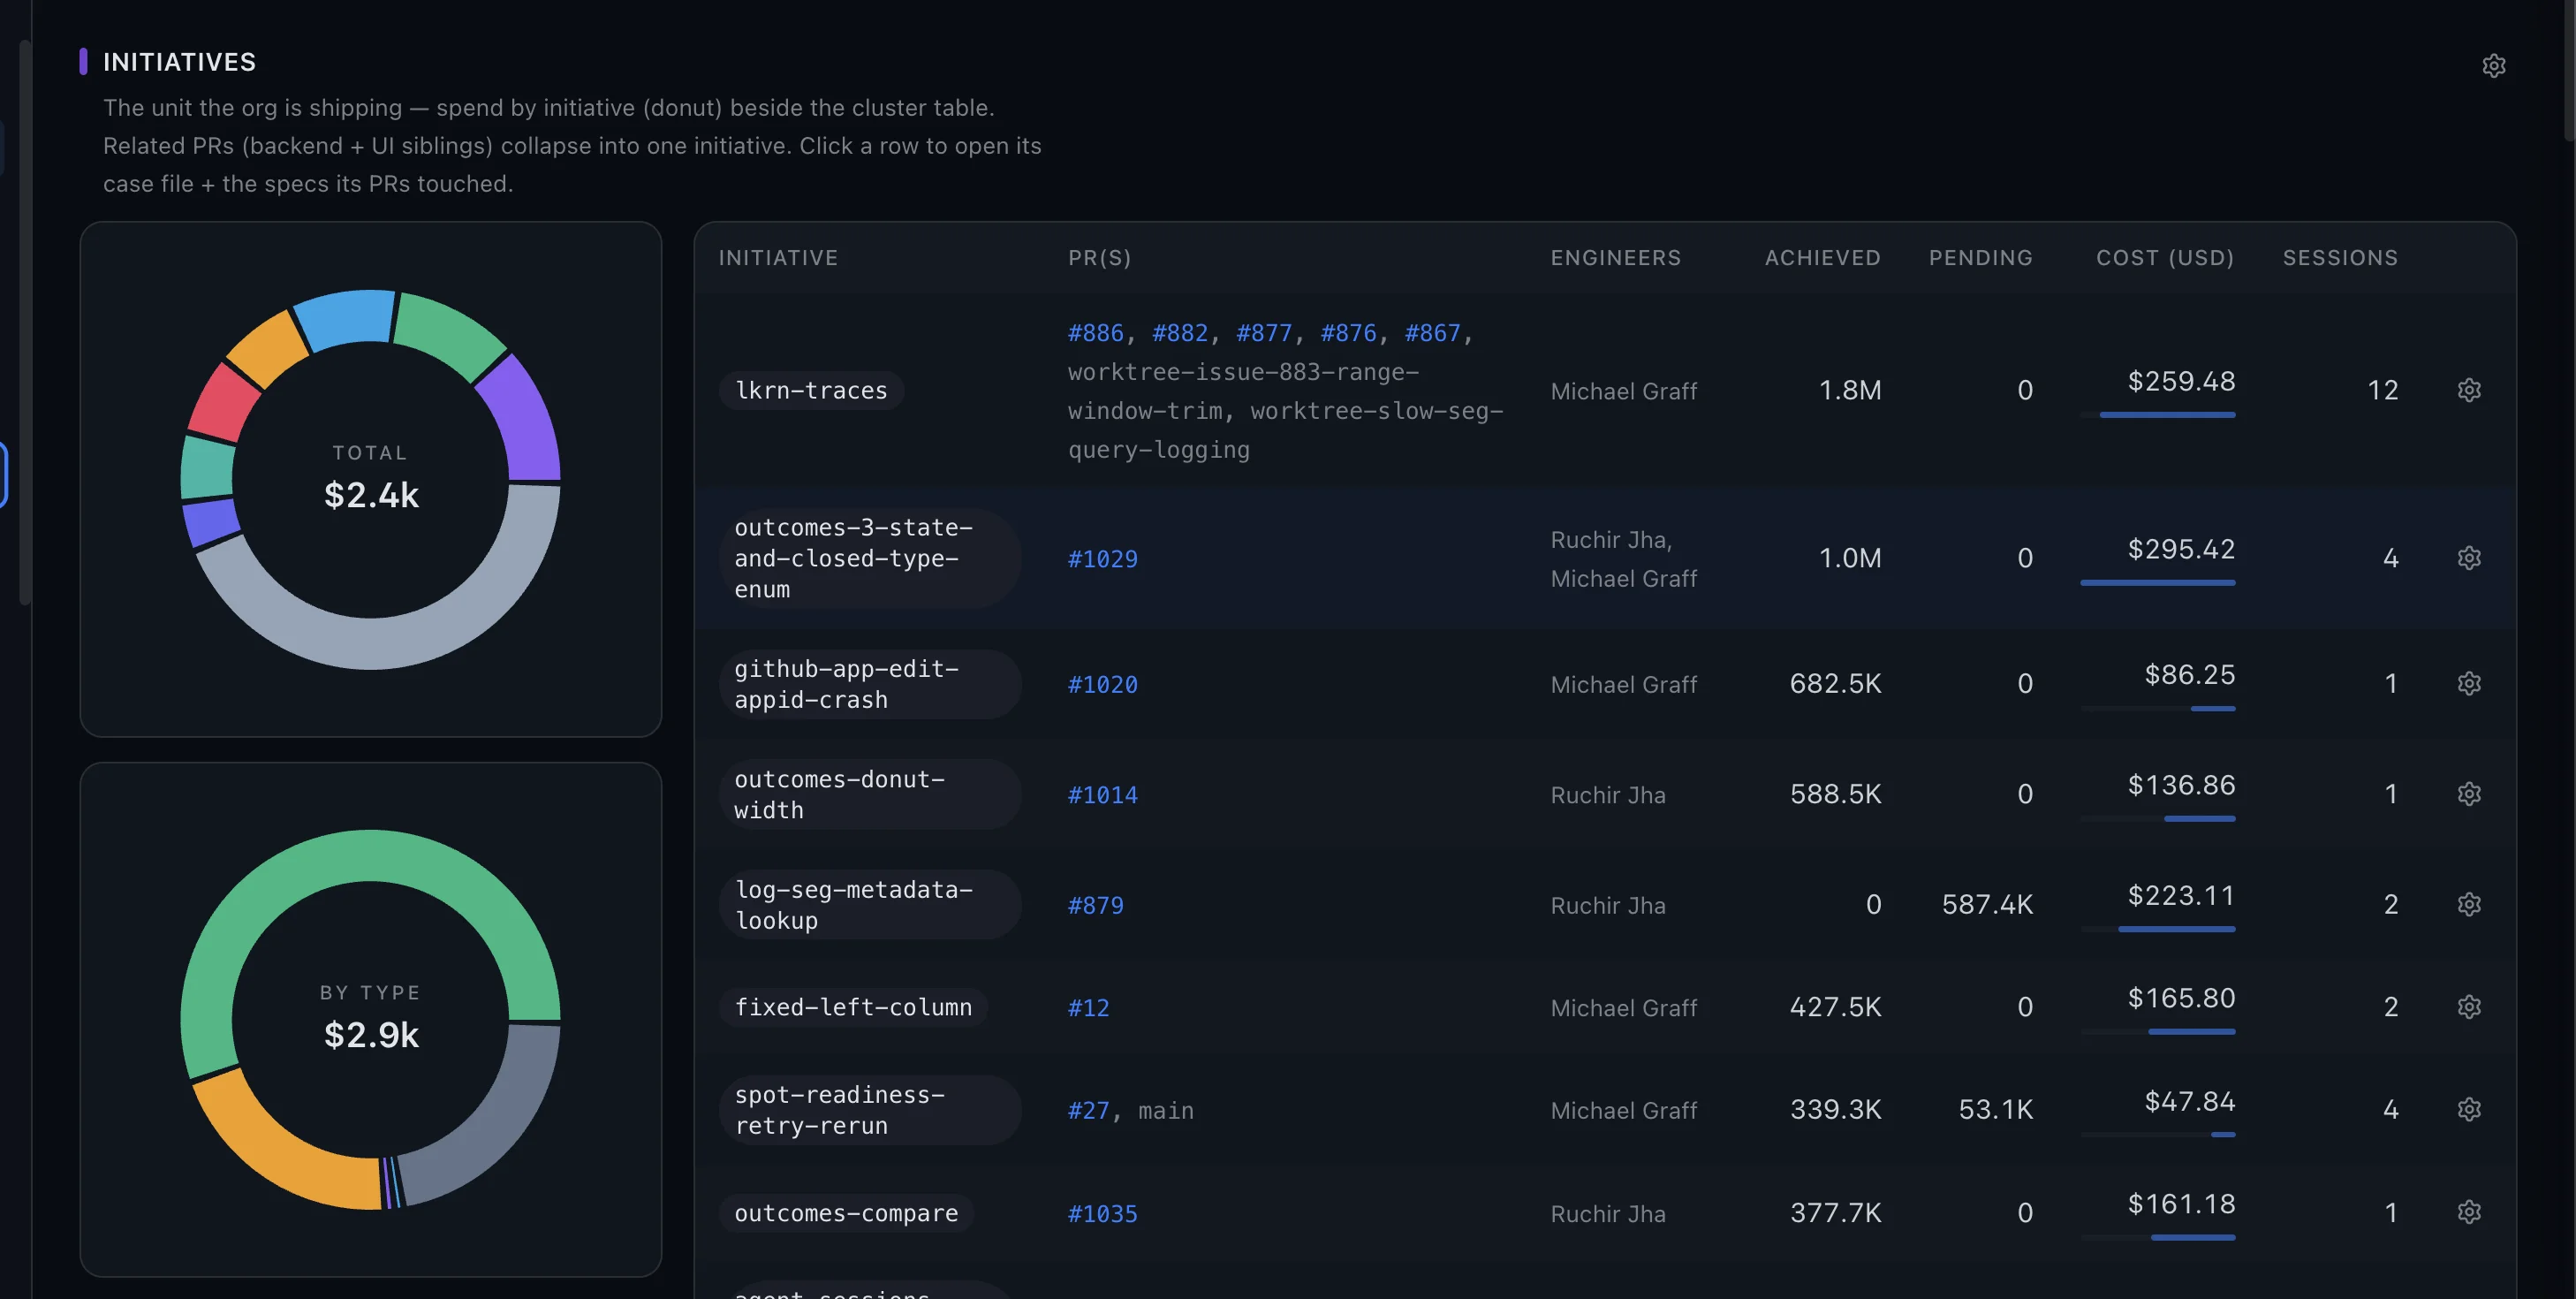
Spend, organized by what you're building
Sessions cluster into initiatives — the unit a manager actually thinks in — not a wall of UUIDs. Each initiative carries its PRs, its engineers, tokens achieved versus still pending, and what it cost. Three clicks from total spend to the single session that caused it.
Every dollar lands somewhere
Each session ends up merged, in flight, exploratory, or lost — there's no fifth bucket where waste hides. Surface cost per durable merged PR and unsuccessful-spend percentage, so the answer to "what are we getting for the agent bill?" is a number, not a shrug.
Limits where the spend happens
Cap spend per initiative, per engineer, per session — the levels where the money actually moves. Soft warnings as a budget tightens, hard stops before the surprise invoice. And a limit isn't an after-the-fact report: the agent sees its own budget standing mid-session and works leaner as it approaches the ceiling.
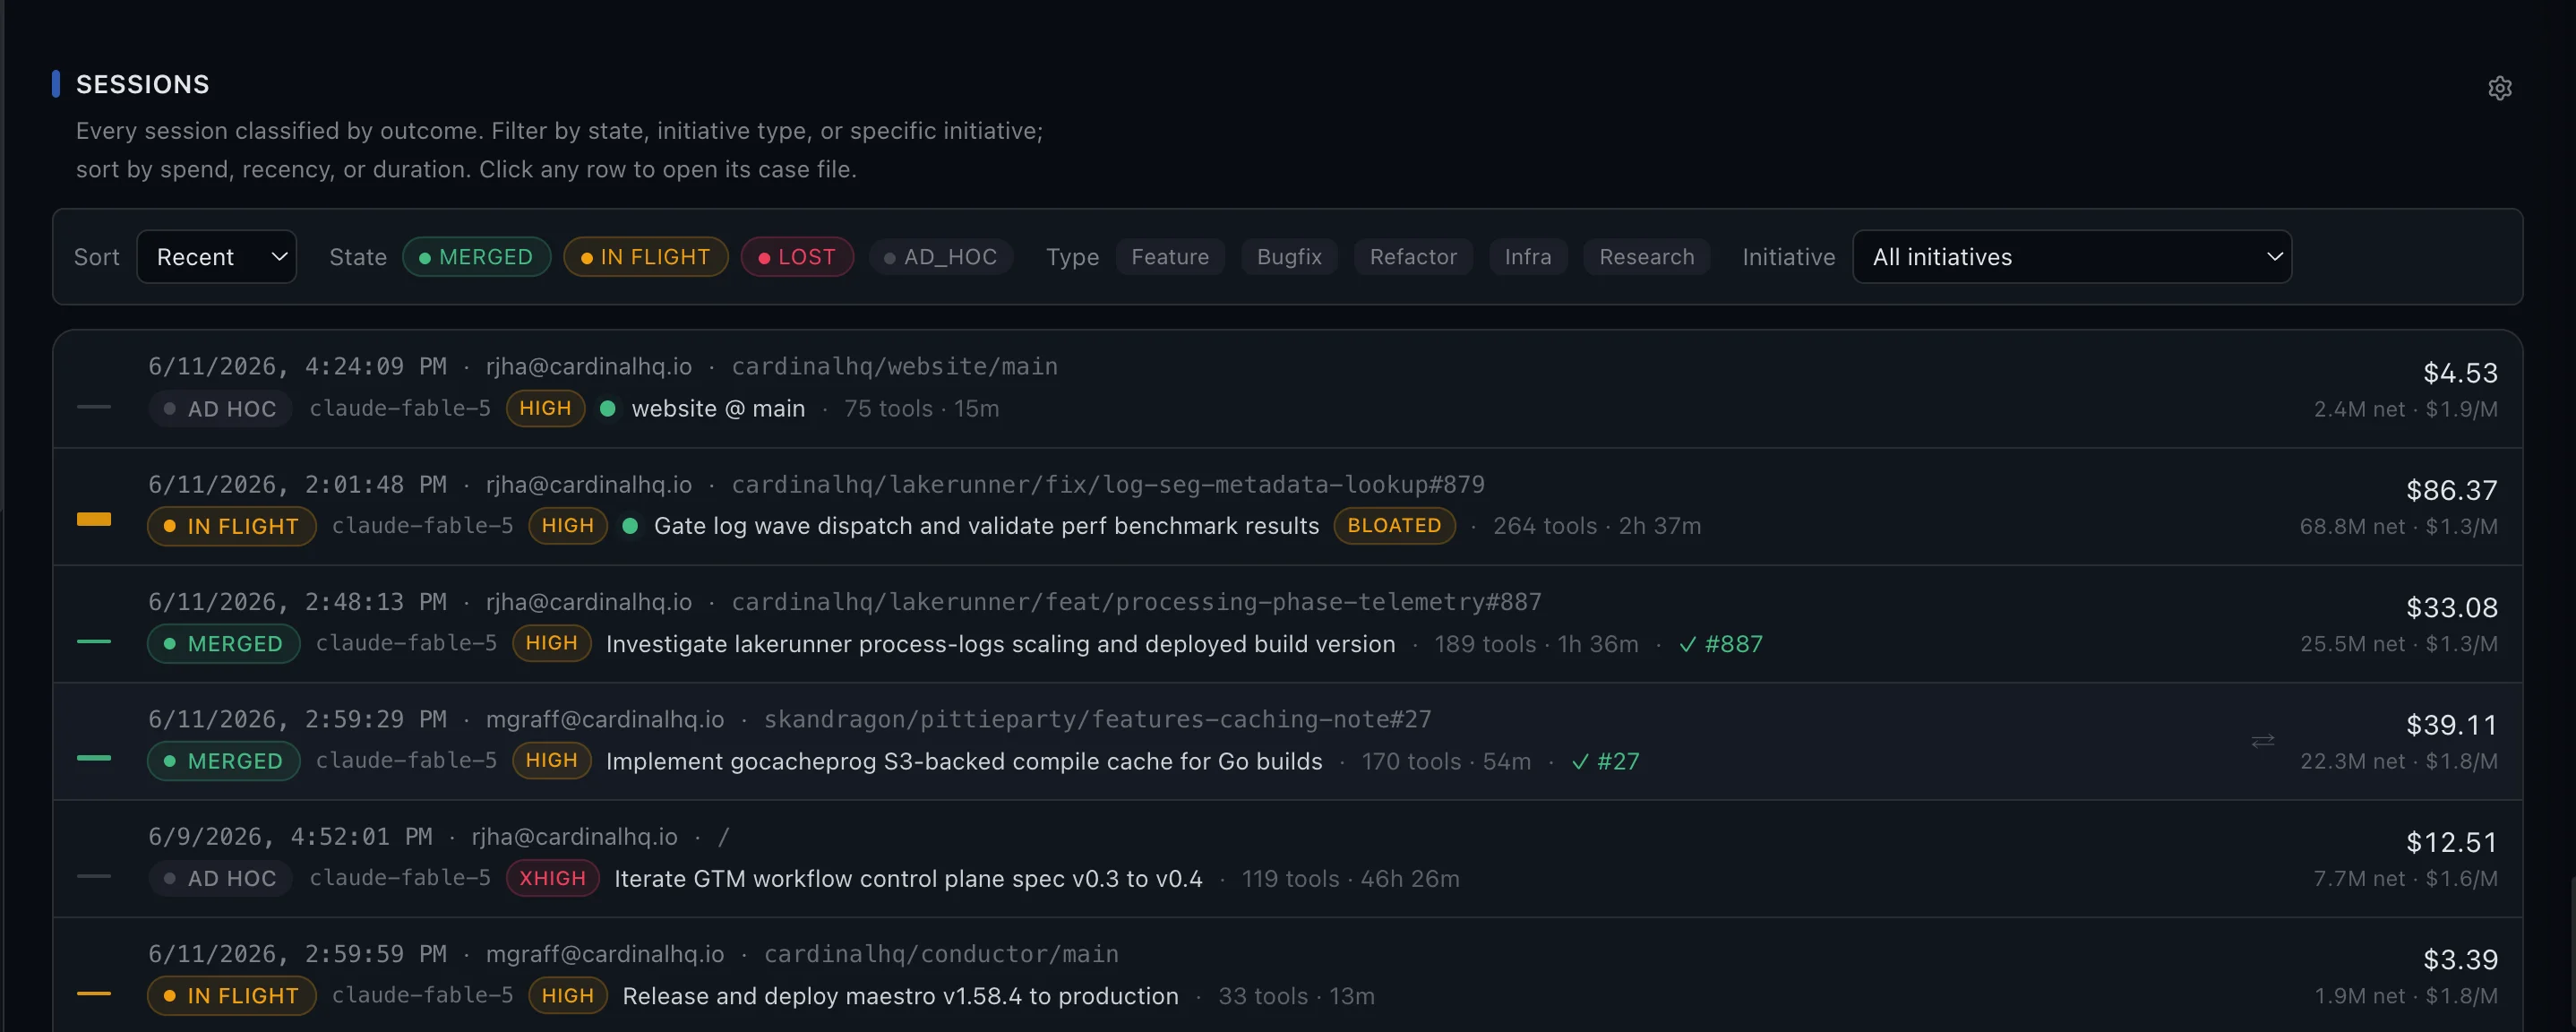
Every session, classified — with the cost next to it.
No credit card required — your first session lands in ~10 minutes
OpenTelemetry native. Works with Claude Code today — Cursor and Codex nextData quality is agent quality
Own your data. Unleash your agents.
Stop sending your telemetry to vendor black boxes. Own it, and let agents do real work on it.
Your data never leaves your cloud
OTEL-native ingestion straight to Object Storage. Cardinal Lakerunner indexes it in place. Agents query through the runtime.
Instrument with OTEL
Standard OpenTelemetry collectors ship logs, metrics, and traces to Object Storage via the OTEL exporter.
Index in Place
Cardinal Lakerunner indexes your data in Object Storage — full fidelity, zero egress, no vendor lock-in.
Agents Query
AI agents connect to the Agent Runtime with pre-built troubleshooting skills and investigation tools.
Ultra High Cardinality
Lets agents quantify which slice actually moved the metric.

Unbounded Lookback
Agents trace root causes across months of data with sub-second query latencies.

Agent Skills, Not API Wrappers
Composite skills that reason, not just fetch.
Each skill is a re-runnable investigation that fires hundreds of queries against your data lake in seconds. No query limits, no per-seat costs. When you own the data, agents can dig as deep as they need to.
Outlier Detector
Automatically decomposes metric spikes across every tag combination and returns impact-ranked attributions agents can act on immediately — no exploratory querying required. Instead of iterating through dimensions one by one, agents receive a single structured answer like "region=us-east, endpoint=/checkout caused 63% of the spike", backed by evidence.

Correlation Finder
Automatically aligns change events — deploys, config updates, scaling actions — against metric timelines so agents get pre-correlated cause-and-effect pairs instead of searching through changelogs themselves. Agents jump straight to "deploy v2.14.3 correlates with the latency spike" without spending tokens on timeline reconstruction.
Error Summarizer
Fingerprint-based clustering reduces thousands of raw errors into deduplicated, ranked error groups agents can reason over without exhausting their context window. Each group comes with volume timelines, first-seen timestamps, and per-service breakdowns — giving agents a structured summary instead of forcing them to parse noisy logs line by line.

Anomaly Detector
Pre-computed statistical baselines let agents run cheap distributional comparisons across massive metric volumes without burning tokens on raw data. Lightweight statistical tests surface exactly which percentiles shifted and by how much — giving agents a fast, reliable way to separate real regressions from normal variance at scale.
Traffic Monitor
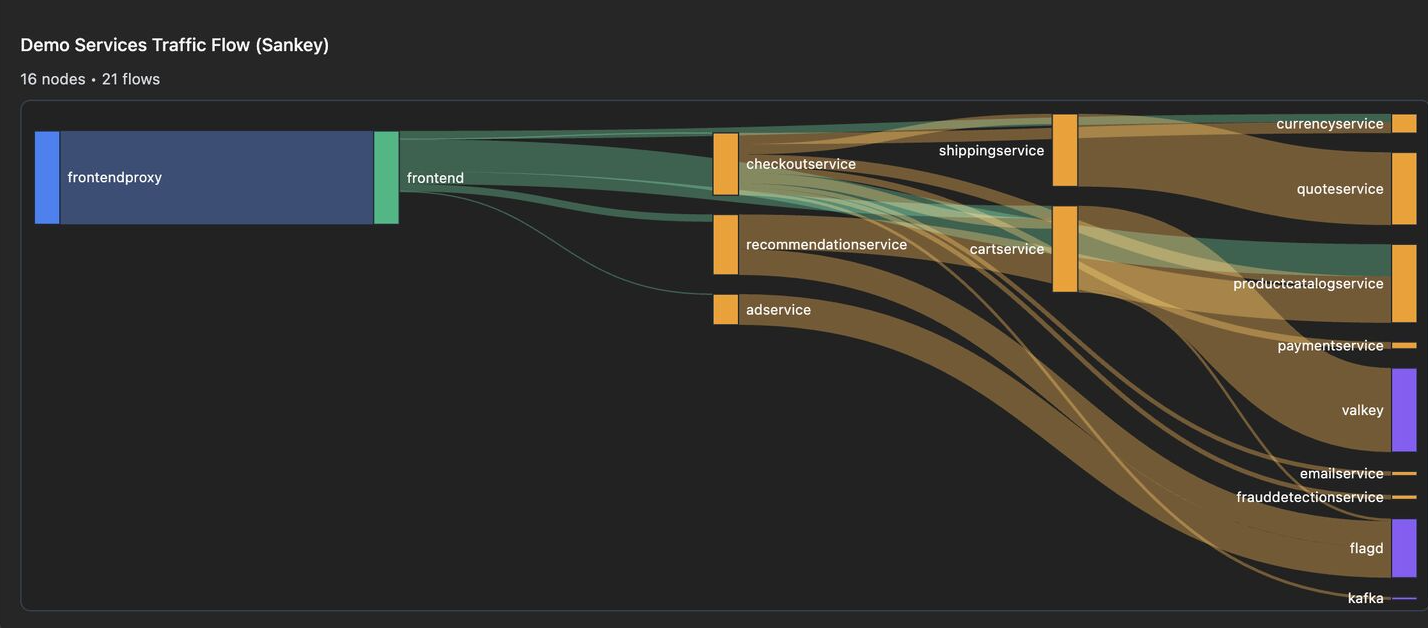
Condenses tracing data into request-flow graphs that let agents do effective attribution — who calls whom, how often, and at what error rate. Instead of sifting through raw spans, agents work from compact representations with real volume numbers and per-edge error percentages to pinpoint exactly which dependency is responsible.
Shared Knowledge
The agent gets smarter with every investigation.
When your SRE troubleshoots a database issue at 2am, the knowledge doesn't disappear with the incident. It becomes a guardrail, a cached pattern, a boosted tool preference. Next time anyone on the team hits something similar, the agent already knows what to do.
Ontology builds itself
Every tool call extracts entities, relationships, and schemas into a shared knowledge graph. Agents know your infrastructure without being told.
Mistakes become guardrails
When a query fails or a user corrects an argument, that lesson is stored as a decision trace. Future runs get injected with "don't do X" hints before they even start.
Patterns get cached
A successful investigation gets fingerprinted and stored. When a similar prompt comes in, the agent skips the entire planning phase and goes straight to execution.
No tribal knowledge loss
Your best engineer's debugging instincts don't leave when they go on vacation. Every correction, every preference, every shortcut lives in the shared stores.