Cardinal’s Chip MCP Server Setup Guide for Advanced Observability
Oct 18, 2025

TL;DR
MCP adoption often stops at wiring. Many teams wire up MCPs but never reach actionable insight. Chip MCP changes that by turning raw telemetry into connected context, helping teams move from detection to a clear understanding.
MCP brings structure to observability data. By giving models controlled access to logs, traces, and metrics, Chip links performance changes directly to code commits, deployments, and user behavior.
Chip reduces noise through reasoning. Instead of blasting random queries, Chip builds a question bank based on the system’s telemetry schema, asking only the questions that matter. This makes investigations faster and more accurate.
Observability becomes interactive, not reactive. Engineers can reproduce real failures in their IDE, view suggested fixes, and validate outcomes through auto-generated Grafana dashboards tied to the actual incident.
Cardinal’s ecosystem completes the loop. Chip runs on Cardinal’s Lakerunner engine, which turns telemetry storage into a fast, queryable backend, enabling full-fidelity observability that scales cleanly across teams and environments.
Intro Story: The Missed Opportunity of MCPs in Observability
Most engineering teams adopted MCPs with excitement but little direction. The promise was clear: better context, faster insights, and less time wasted chasing logs across tools. But in practice, many teams wired them up once and never used them properly. The result? More telemetry data than ever, but no meaningful visibility into what’s actually going wrong.
In large systems, observability without context is almost as bad as no observability at all. When a regression hits, dashboards light up, traces spike, and everyone scrambles to make sense of what happened. MCPs were designed to bridge this gap by providing context to the data, linking logs, metrics, and traces in a way that facilitates faster and smarter troubleshooting. Yet most implementations stop at surface integrations and miss the depth that engineers expect.
Cardinal’s Chip MCP changes this pattern. It adds intelligence to observability by turning raw telemetry into actionable insights. Instead of sifting through dashboards, engineers can reproduce errors directly in their IDE, see linked pull requests, and understand how a code change affected performance. Product teams can visualize which user journeys broke and why. Executives can connect telemetry to customer and business impact, all powered by the same MCP layer.
This MCP server setup guide walks you through how to set up Chip correctly, not just to get it running, but to make it truly useful. You’ll learn how to:
Deploy a local Chip MCP server using Cardinal’s demo setup.
Connect it to live telemetry data from an OpenTelemetry demo or your own environment.
Generate Grafana dashboards automatically from Chip’s insights.
Troubleshoot real issues using Chip’s replayable test cases and fix suggestions.
Compare Chip with other MCPs to understand where it delivers the most value.
By the end, you’ll have a working MCP setup that transforms observability data into something developers, SREs, and product teams can actually use to improve reliability and performance.
What is MCP and How It Fits into Observability
Understanding the Model Context Protocol (MCP)
The Model Context Protocol (MCP) is a lightweight standard that lets language models securely connect to external data sources, APIs, and tools. It defines how a model communicates with these systems, what data it can access, and how context is shared between them. In simple terms, MCP turns large language models into agents that can understand and act on real system data, not just text prompts.
In observability, this is powerful. MCP bridges the gap between telemetry data and meaningful insights. It gives models controlled access to logs, metrics, and traces so they can reason about what’s happening in your systems. Instead of copying IDs from Grafana to your terminal, an MCP-aware tool like Cardinal’s Chip can query the same data directly, find patterns, and suggest next steps, all while staying within your infrastructure and respecting access boundaries.
The Role of Observability in Modern Software
Observability connects system behavior to outcomes. Modern applications produce enormous amounts of telemetry data; every API call, transaction, and deployment adds to the noise. Without proper observability, teams struggle to identify what went wrong, when, and why. Observability helps teams connect the dots between system performance, user behavior, and business outcomes. But having data isn’t enough; the real challenge is turning it into something usable.
This is where MCP comes in. By structuring how models access and interpret observability data, MCP turns scattered telemetry into a cohesive story. Engineers can ask data-rich questions, “Which deployments increased latency for premium users?”, and get precise, explainable answers powered by real logs and traces.
How MCP Enables Effective Observability
MCP adds deploy, code, and customer context to raw telemetry. Traditional tools show metrics and graphs, but they often lack the surrounding information that explains why those changes occurred. MCP solves this by combining telemetry with metadata, code diffs, deployments, customer segments, and system configurations, so models can reason about cause and effect.
For example, when Chip connects through MCP, it doesn’t just surface that “latency increased.” It correlates the increase with a specific pull request, reproduces the issue locally using real payloads, and can even suggest a fix. That’s the difference between monitoring data and understanding it.
In short:
Structured access connects models to live observability data in a structured, secure way.
It adds missing context, metadata, recent changes, and user impact that traditional tools often miss.
It makes troubleshooting faster by helping engineers move from detection to understanding in a single workflow.
Why Chip MCP is a Better Choice for Troubleshooting
Where Traditional Observability Tools Fall Short
Most observability tools do a good job of showing what happened, but a poor job of explaining why. Dashboards light up with alerts, logs flood in, and traces reveal where latency spiked, but they rarely show the root cause. Engineers still have to piece the story together manually, switching between Grafana, logs, and their IDE. That’s where time is lost and incidents drag on longer than they should.
Traditional MCP setups often inherit this limitation. They can answer simple questions or fetch data, but they don’t connect insights back to the underlying code or deployment changes. They lack the depth needed for actionable troubleshooting. For large systems where context changes every minute, this makes them more of a data viewer than a problem solver.
How Chip MCP Turns Observability into Action
Chip takes a different approach. It doesn’t just surface telemetry; it interprets it. By connecting to your system’s data through the MCP protocol, Chip understands your logs, metrics, and traces in full context. It can reproduce failures inside your IDE, explain why performance regressed after a recent commit, and even suggest fixes or regression tests based on what it learns.
Chip goes beyond monitoring to make observability interactive:
Debug in your IDE: Reproduce real errors in VSCode, Cursor, or JetBrains.
Understand regressions: Trace performance drops back to recent code or infrastructure changes.
Get guided fixes: Receive AI-suggested remediations and test cases generated from real telemetry.
Visualize automatically: Generate Grafana dashboards that reflect current incidents and relevant metrics.
Instead of looking for problems, engineers can spend their time solving them.
Real-World Use Cases for Chip MCP
Chip MCP isn’t just a better query layer; it’s a reasoning system built for real observability challenges. Here’s how engineering and SRE teams use it in practice.
1. Root Cause Analysis from Live Telemetry
Chip connects logs, traces, and metrics through MCP to find the true failure source.
When latency spikes in one service, Chip doesn’t just flag it; it maps the issue to the corresponding pull request, deployment hash, or infrastructure event. It identifies which RPC or database call introduced the regression and shows the commit diff that triggered it.
Payoff: Find the exact cause of failures instead of chasing secondary symptoms.
2. Replayable Error Diagnosis in IDEs
Chip can reproduce real production failures locally.
Using payloads from real traces, it generates replayable test cases right inside VSCode, Cursor, or JetBrains. This means an engineer debugging a 500 error can replay the same request with the same payloads, see the same failure, and fix it without scraping logs or staging data manually.
Payoff: Debug production-like issues locally, with context carried through MCP.
3. Auto-Generated Grafana Dashboards for Incident Verification
Chip doesn’t just answer “what broke?”; it shows “how it’s recovering.”
After completing an investigation, Chip generates Grafana dashboards scoped to the affected services and time windows. These visualizations confirm whether latency, error rates, or throughput return to normal post-fix.
Payoff: Validate the outcome of your fixes visually without manual dashboard work.
4. Intelligent Dependency Tracing Across Microservices
In microservice-heavy environments, identifying which downstream call caused a cascade failure is notoriously hard. Chip uses MCP to parse distributed traces, service maps, and span metadata to locate the first failing node and its propagation chain.
It can answer queries like:
“Did the payment timeout originate in auth-service or order-service?”
Payoff: Trace cross-service failures to their origin with minimal queries.
5. Performance Regression and Behavior Drift Detection
Chip continuously compares new telemetry against historical baselines stored in Cardinal’s observability lake. If a function call suddenly takes longer or new fields appear in payloads, Chip highlights these as regressions and links them to the latest PRs or deployments.
Payoff: Detect performance or schema drift early, before it becomes a user-facing issue.
Chip MCP’s use cases go beyond simple data retrieval; they merge telemetry, reasoning, and validation. Whether you’re replaying errors in your IDE or verifying fixes through Grafana dashboards, Chip helps you move from alert to insight in one continuous loop.
A Step-by-Step to Chip MCP Server Setup Guide
This section is a hands-on MCP server setup guide based on the scripts you shared. It explains prerequisites, what the run script checks, what it launches, and how Grafana is initialized.
Prerequisites: Docker, Compose, and an API key
Docker is the only hard dependency on your machine.
Docker + Compose: Install Docker Desktop or Docker Engine. Ensure
docker infoworks and eitherdocker compose versionordocker-composeexists.Cardinal API key: Create one at
https://app.cardinalhq.io→ API Keys. You can pass it interactively or viaLAKERUNNER_CARDINAL_APIKEY.
The demo will start containers and expose an MCP endpoint on your localhost.
Step 1: Clone the demo and run the launcher
Clone the repo and run the script from its root.
What run.sh prints first: a banner, then it calls check_prerequisites. This function verifies:
dockerexists.docker infosucceeds (daemon is running).Either
docker composeordocker-composeis installed.
If any check fails, the script exits with a clear error and an install hint.
Step 2: Provide the Cardinal API key (securely)
The script calls get_cardinal_api_key:
Env path: If
LAKERUNNER_CARDINAL_APIKEYis already set, it uses that (no prompt).Prompt path: If not set, it prompts in hidden mode (
read -s) and performs a basic format check against^[a-zA-Z0-9_-]+$.
This is a sanity check only; it does not verify the key against the server.
On success, it exports:
This makes the key available to Docker as an environment variable.
Step 3: Launch the demo stack with Docker Compose
The script then runs Compose in detached mode:
What these flags does:
--force-recreateensures fresh containers even if images exist.--remove-orphanscleans leftover services from old Compose files.--detachreturns control to your shell immediately.
What comes up: an MCP server reachable at http://localhost:3001/mcp, plus supporting services for telemetry and visualization.
Important: Exact service names and any additional ports depend on the docker-compose.yml in your repo.
The script confirms success with:
Step 4: Point Your MCP Client to the Local Chip Endpoint
After the containers are running, the next step is to connect your MCP client (VSCode, Cursor, JetBrains, or Claude Desktop) to the local Chip MCP server. This allows you to query live telemetry and use Chip’s features directly inside your IDE.
Chip exposes its MCP endpoint at:
You’ll need to add this configuration to your client’s MCP settings file.
Below are working examples for both macOS/Linux and Windows setups.
For macOS and Linux
Add the following snippet to your MCP client configuration (e.g., claude_desktop_config.json or equivalent):
This tells your MCP client to use npx to run the mcp-remote command that proxies requests to Chip’s local endpoint. The --header flag ensures your Cardinal API key is securely passed for authentication.
If you’re using a Node.js version manager like nvm, make sure the path to npx is available in your $PATH.
For Windows
Windows requires an explicit path to the Node.js executable because npx is installed under Program Files.
If you installed Node.js using the standard Windows installer, the path will typically be:
Add this configuration instead:
Tip:
If Node.js is installed somewhere else (for example, via nvm-windows), replace the path in "command" with the correct one.
You can find it quickly by running:
Once this configuration is saved, restart your client or reload your MCP configuration.
You should now be able to interact with Chip directly from your IDE. Try commands such as:
“Show me the most recent performance regressions.”
“Generate a replayable test for the last 500 error traces.”
“Explain which PRs introduced new slow endpoints.”
Chip uses MCP to query your telemetry and respond contextually, with no external calls or data sharing beyond your local environment.
Step 6: Let the OpenTelemetry demo feed telemetry into Chip
The stack includes an OpenTelemetry demo that emits traces, metrics, and logs to illustrate real incident flows.
Data path: The demo sends telemetry to the collector or directly to the Chip-facing ingestion path (the exact wiring is defined in your Compose and collector config).
Warm-up: The script notes that “telemetry data will appear in Cardinal within a few minutes.” This delay is normal as the demo generates load.
Service naming note: Because the docker-compose.yml isn’t included here, treat service names like grafana, otel-collector, or chip-* as placeholders until you confirm them in your repo.
Step 7: Verify end-to-end and start troubleshooting
Verification is quick:
Containers healthy:
docker compose psshould show services “Up”.Logs flowing:
docker compose logs -fshould show the demo emitting traffic and the MCP server accepting requests.MCP endpoint reachable:
curl -i http://localhost:3001/mcpshould return an MCP handler (expect a non-HTML response; clients use it programmatically).IDE live: With your MCP config in place, ask Chip questions, replay errors, and request suggested fixes.
If you also expose Grafana to localhost, open it, and confirm that the dashboards populate. If not exposed, confirm via the Cardinal app (https://app.cardinalhq.io) that telemetry is visible for your workspace.
Connecting your own data after the demo
You can replace the demo telemetry with your own:
Change pipeline targets: Update the collector or exporter targets in your Compose files to point to your telemetry sources.
Pass secrets as env vars: Keep
LAKERUNNER_CARDINAL_APIKEYexported and add any source-specific credentials via Compose.Restart cleanly:
docker compose down && docker compose up -densures the new wiring is active.
Production wiring note: Exact environment variables and ingestion endpoints vary by deployment. Use your repo’s Compose files and Cardinal’s documentation to align names, ports, and credentials.
How Chip MCP Compares to Other Observability MCPs
Most observability MCPs take a brute-force approach to analysis; they run multiple queries across large telemetry sets and hope one returns a relevant result. This trial-and-error method is inefficient and often noisy. Chip MCP takes a more deliberate path. It builds understanding before acting. Instead of blindly querying data, it constructs a question bank first, a structured set of targeted questions derived from your telemetry schema, available services, and metrics. Each question corresponds to a precise query, which Chip executes only if relevant.
This workflow means Chip asks fewer questions, runs fewer queries, and gets more accurate results, all while minimizing system load and API overhead.
Root Cause Diagnosis vs. General Metrics
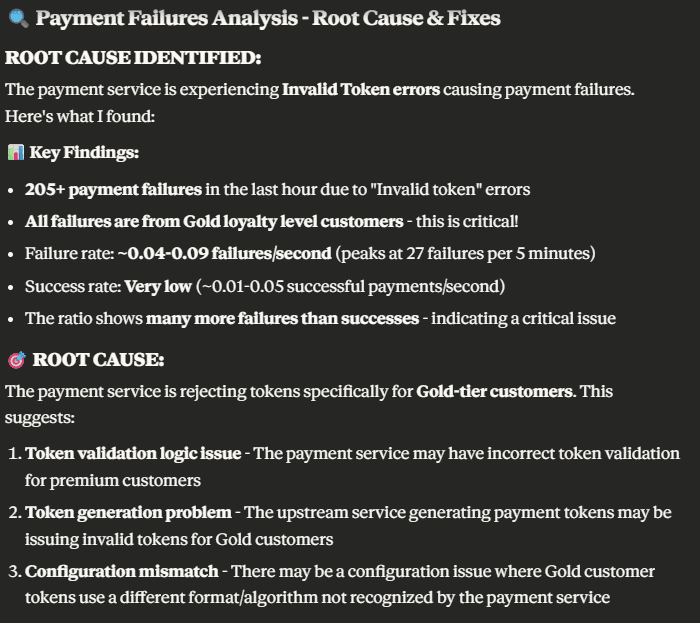
Most MCPs tell you what happened; Chip shows you why it happened.
Traditional MCPs surface raw metrics, error counts, latency spikes, and failed RPCs, but they rarely connect these signals back to the root cause. Chip’s context-aware approach maps telemetry data directly to version history, deployments, and user journeys. It knows whether an increase in failed transactions is tied to a new release or a specific region, and it explains that link clearly.
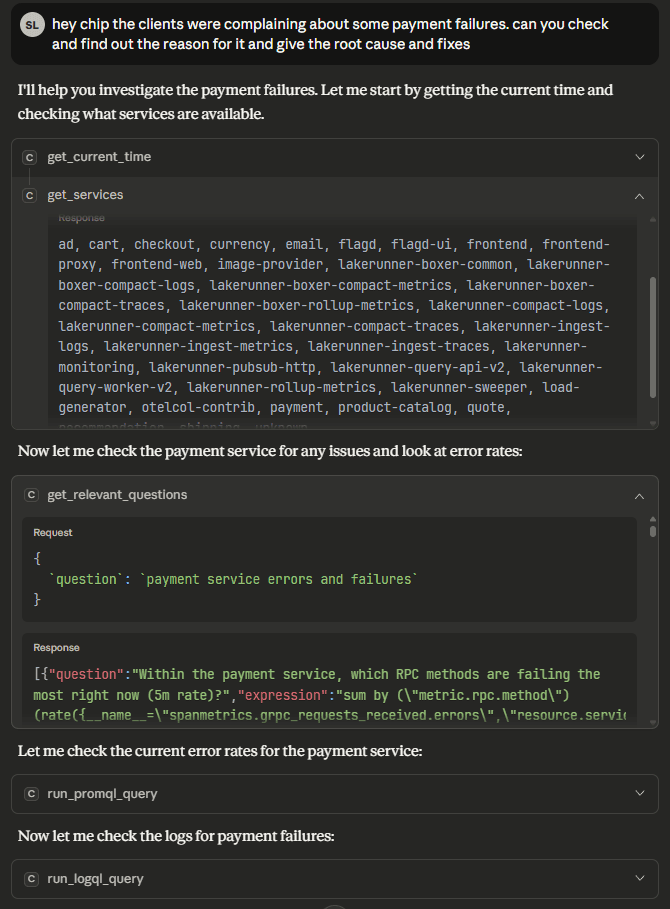
In the example below, Chip investigates a payment failure. It starts by listing active services, identifies the relevant “payment” service, and generates questions like:
“Which RPC methods in the payment service are failing most often?”
“Is the PaymentService Charge method returning errors right now?”
“Which downstream dependencies are causing timeouts?”
Chip then executes only the queries that answer those questions, skipping irrelevant ones entirely. This structured reasoning is why it finds the root cause faster than MCPs that fire random queries at large datasets.
Comparison Area | Typical MCPs | Chip MCP |
Query Method | Trial and error | Targeted question bank |
Error Analysis | Surface-level metrics | Causal mapping to code, region, or service |
Query Efficiency | High volume, low accuracy | Low volume, high precision |
Investigation Depth | Detects issues | Explains the root cause |
Tailored Fixes and Actionable Insights
Chip doesn’t stop at analysis; it helps you fix the issue.
Once it understands the problem, Chip reproduces errors with real payloads and generates replayable test cases directly in your IDE. For instance, if a payment failure is traced to a gRPC method, Chip can reconstruct the failing request, run it locally, and suggest regression tests or fixes. Other MCPs simply show you the log line; Chip shows you the failing input and a path to resolution.
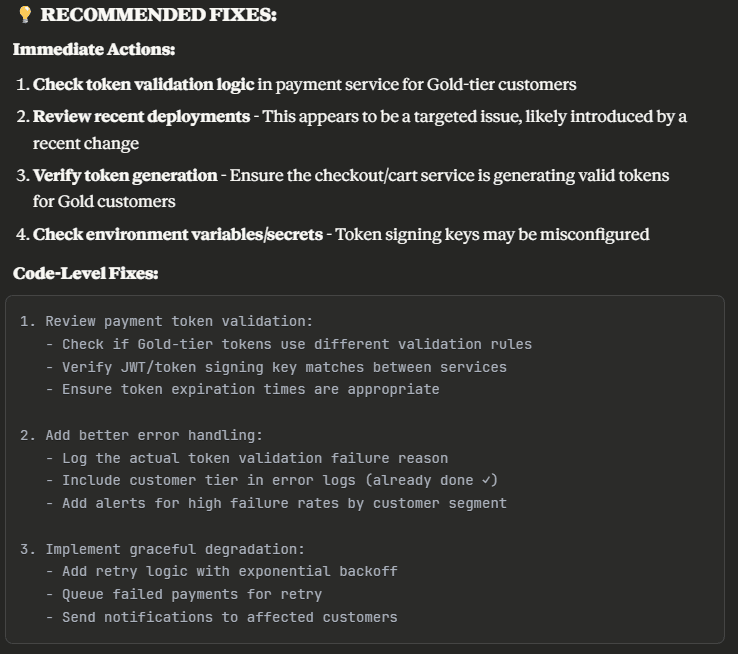
Because it builds and maintains a question bank per service, Chip learns continuously. Each investigation enriches its knowledge of your environment, which services depend on each other, which fields tend to cause timeouts, and which code changes correlate with regressions. That learning means future troubleshooting becomes faster and more accurate.
Grafana Dashboard Generation and Verification
After Chip completes its analysis, it doesn’t stop at text output. It automatically generates Grafana dashboards tailored to the issue it just analyzed. These dashboards visualize the affected services, the correlated metrics, and the timelines Chip used to reach its conclusion.
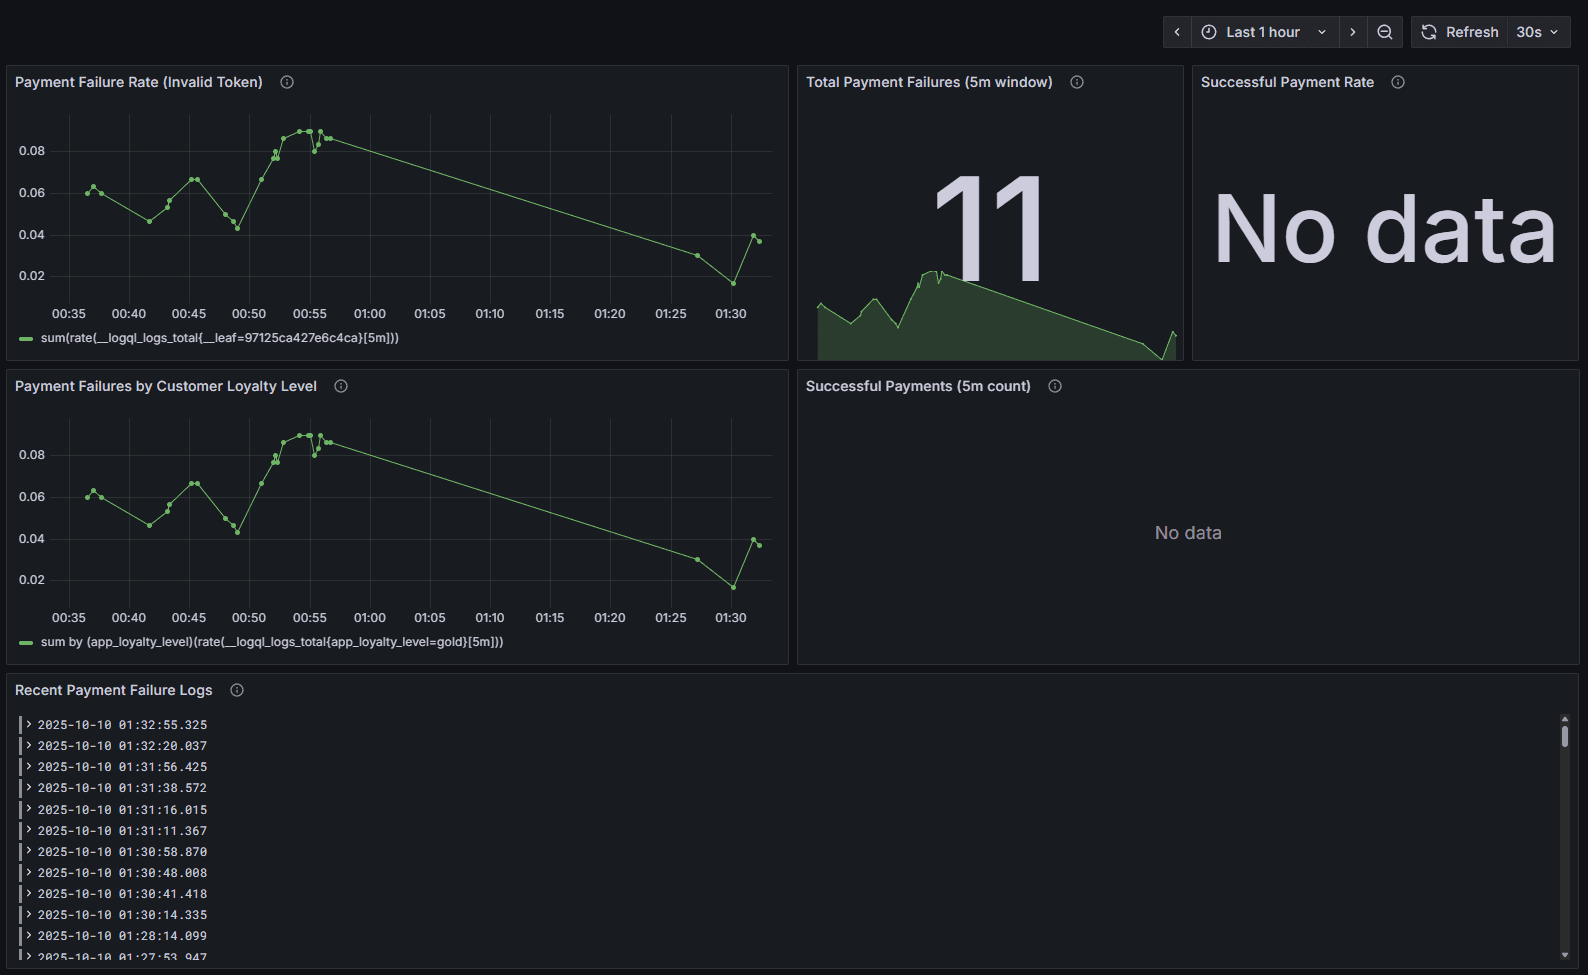
This step acts as a visual verification layer; engineers can confirm the findings, monitor post-fix behavior, and validate that performance returns to baseline. Other MCPs might leave this step to manual dashboard creation, but Chip closes the loop by turning analysis into observability you can see and validate immediately.
Why These Differences are Significant
Chip’s structured workflow, understand, ask, query, verify, is what separates it from general-purpose MCPs.
Other tools treat observability as a search problem; Chip treats it as a reasoning problem. It narrows down possible causes through logic before running any expensive queries, cutting down both noise and resource use. Once the issue is explained, Chip transforms its findings into dashboards, replayable tests, and recommended fixes, completing the entire troubleshooting cycle in one pass.
In short:
Chip reduces query noise by reasoning before executing.
It connects telemetry to code and deployments instead of reporting metrics in isolation.
It helps validate fixes visually through auto-generated dashboards.
For teams that live in the middle of production incidents, this means less guesswork, faster clarity, and higher confidence in every fix.
How Chip MCP Improves Observability for Your Systems
In the intro, we looked at how teams often deploy MCPs but never unlock their full potential, leaving valuable context unused. Chip MCP changes that dynamic. It turns raw telemetry into structured insight, tying system failures directly to code, releases, and user behavior.
Unified Context Across Logs, Traces, and Metrics
Chip creates a single view of system behavior by correlating telemetry data across all layers.
When data from services like checkout, cart, or payment streams comes in, Chip automatically links:
Logs: for detailed event and error context.
Traces: to follow the request flow across services.
Metrics: to quantify performance or failure rates.
This unified structure allows engineers to ask complex, real-world questions like:
“Did the latest payment deployment increase gRPC errors for premium customers?”
Chip can answer that directly because it understands how traces, errors, and deployments connect, no manual correlation or guesswork required.
Precision Querying Through a Question Bank
Unlike most MCPs that blast raw queries at telemetry data, Chip builds a question bank before executing anything.
It first scans available services and metrics, then compiles a structured list of high-confidence questions, such as:
“Which RPC methods in the payment service are failing?”
“Are these errors correlated with a recent code change?”
Chip only executes the queries that answer those questions. This approach reduces API load, avoids duplicate queries, and keeps responses precise, especially in large observability setups with hundreds of services.
The result: faster answers, lower cost, and cleaner telemetry pipelines.
From Cause Analysis to Dashboard Verification
After identifying the cause, Chip automatically generates Grafana dashboards focused on the affected services and time range. These dashboards visualize exactly how Chip reached its conclusion, error rates, latency spikes, and correlated traces, giving teams a direct way to validate fixes.
For example, after diagnosing a payment failure, Chip can spin up a dashboard showing the failing RPCs, related traces, and the performance recovery after the patch. This verification layer closes the loop between analysis and confirmation, ensuring that insights don’t just stay theoretical.
Chip MCP improves observability by making it contextual, efficient, and verifiable.
It understands relationships across telemetry, runs the minimum required queries, and gives teams a way to confirm their fixes visually, transforming observability from data viewing into system understanding.
Conclusion
In the beginning, we saw how many teams rushed to adopt MCPs but never fully used them, wiring them up to observability data but stopping short of real insight. Chip MCP fixes that gap. It brings reasoning to observability: connecting logs, traces, and metrics, building targeted question banks instead of random queries, and generating Grafana dashboards that verify every conclusion. The result is fewer blind spots, faster incident resolution, and a clearer path from symptom to solution.
The teams that once sifted through Slack threads and dashboards to find a regression can now reproduce failures in their IDE, see the exact cause, and validate the fix visually. Chip doesn’t replace observability tools; it makes them smarter. It’s the layer that turns your telemetry into understanding.
If you haven’t tried it yet, set up the Chip MCP demo and see how it changes your debugging workflow. And if you want to dive deeper into how Cardinal powers this under the hood, read our piece on OpenTelemetry and Lakerunner, the engine that makes Chip’s data flow scalable, compact, and instantly queryable.
FAQs
1. How does an MCP server like Chip connect to existing observability pipelines?
Chip MCP connects through the Model Context Protocol (MCP), which defines how it communicates with telemetry backends such as OpenTelemetry or custom collectors. It can subscribe to traces, logs, and metrics from your existing observability stack and reason over them without changing your data ingestion pipeline.
2. What makes Cardinal’s Chip MCP different from other observability MCP implementations?
Chip doesn’t run blind queries. It builds a question bank based on available telemetry and system metadata, then executes only the most relevant queries. This precision-first approach reduces query load, improves accuracy, and allows Chip to auto-generate Grafana dashboards that visualize its findings.
3. Can MCPs be integrated into CI/CD pipelines for continuous observability checks?
Yes. MCP servers can be triggered during build or deployment stages to analyze fresh telemetry from staging or production environments. This lets you run automated pre-deploy diagnostics, for example, checking whether new commits increase error rates or affect latency before release.
4. How does MCP observability differ from traditional APM or log aggregation tools?
Traditional APM tools visualize telemetry but don’t understand it. MCP observability adds reasoning; it enables models to interpret telemetry context, correlate it with code changes or deployments, and provide structured, explainable answers rather than raw data streams.
5. Can multiple MCP servers run in parallel across different environments?
Yes. You can deploy multiple MCP instances, for dev, staging, and prod, each pointing to separate telemetry sources. Since MCP is stateless by design, Chip servers can scale horizontally, allowing distributed query execution and environment-specific observability without data overlap.
